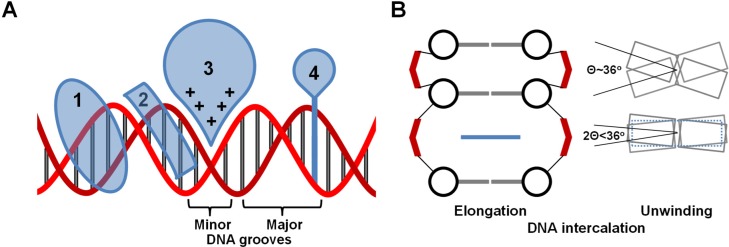
Figure 1.
(A) Schematic diagrams of different DNA binding modes: 1 is a major groove binder, 2 is a minor groove binder, 3 represents electrostatic/allosteric binding and 4 is an intercalator. The DNA backbone is in red and the base pairs in gray. (B) Diagrammatic Illustration of intercalated DNA helix elongation (left) and unwinding (right). The phosphate groups are shown in red, the deoxy sugar in black, the base pairs in gray and the intercalator in blue. The diagrams illustrate that the separation between the intercalated base pairs is nearly doubled, while more than half of the native DNA helix twist is unwound to compensate for the elongation.

