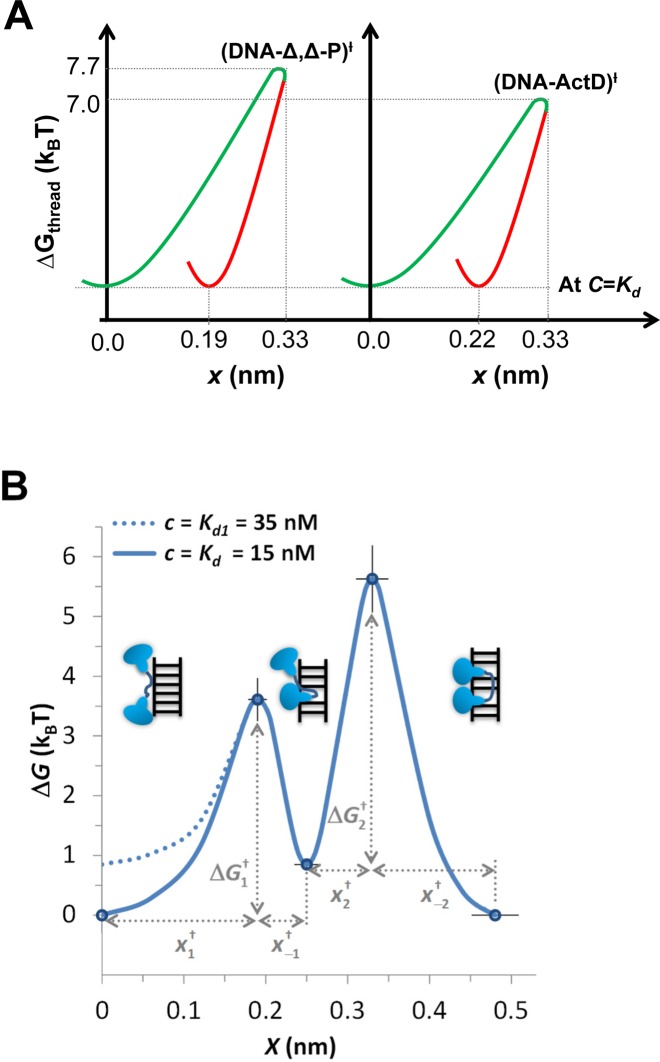
Figure 13.
(A) Comparing the free energy landscape of Δ,Δ-P and ActD upon intercalating DNA at C = Kd(0) (Kd(0) = 44 nM for Δ,Δ-P, and Kd(0)∼1 μM for ActD). The diagram illustrates the shared lock mechanism, in which the DNA helix deformation relaxes to smaller elongation in the equilibrium state. (B) Zero-force free energy profile of the DNA/Δ,Δ-Pc complex versus elongation, from (44). The three free-energy minima on this diagram correspond to the non-intercalated, mono-intercalated and bis-intercalated states illustrated in the figure. At the Δ,Δ-Pc concentration of C = Kd= 15 nM, the free energy of the non-intercalated and bis-intercalated states are the same and are taken here as the zero free energy reference state. At higher C = Kd1 = 35 nM the free energies of the non-intercalated and the mono-intercalated states are the same, and equal to kBT.ln(K2) = kBT.ln(35/15) = 0.85 kBT. Only the non-intercalated state free energy is affected by C, as illustrated by the two lines (solid line for 15 nM and dashed line for 35 nM).

