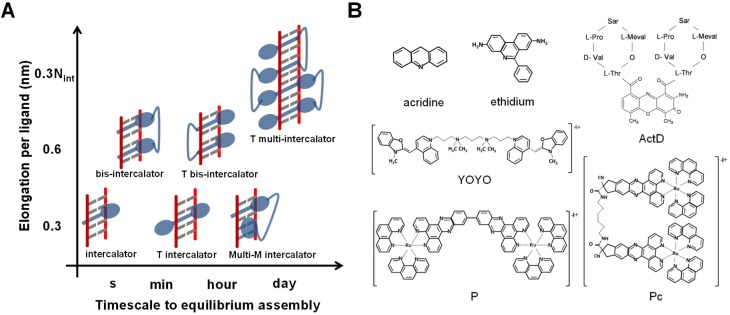
Figure 2.
(A) DNA intercalators as classified by the number of intercalation events per ligand, elongation per ligand and typical timescale to reach the equilibrium intercalative state. The intercalators are shown in blue, the DNA backbone in red and the base pairs in gray. M stands for mode, and T for threading. (B) Examples of intercalators from different classifications.

