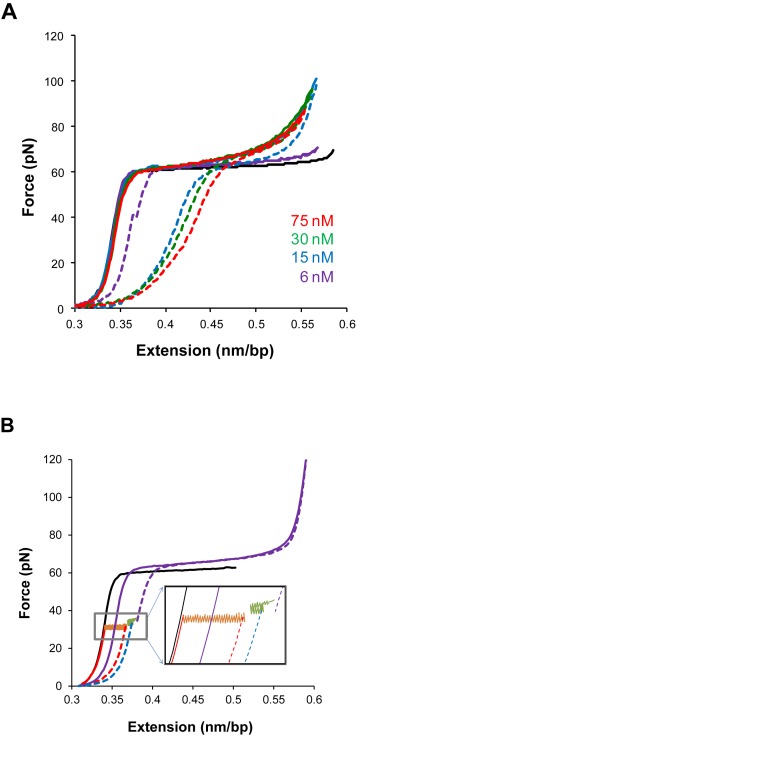
Figure 7.
The slow kinetics of unconventional DNA intercalation, from (45). (A) Stretch-release cycles of the DNA–ActD complex show considerable hysteresis between the stretch (solid lines) and release (dashed lines) parts of the cycle, indicating non-equilibrium measurements. (B) Measurements illustrating the slow kinetics of unconventional DNA intercalation and showing how constant force measurements ensure that DNA equilibrium elongation is reached.

