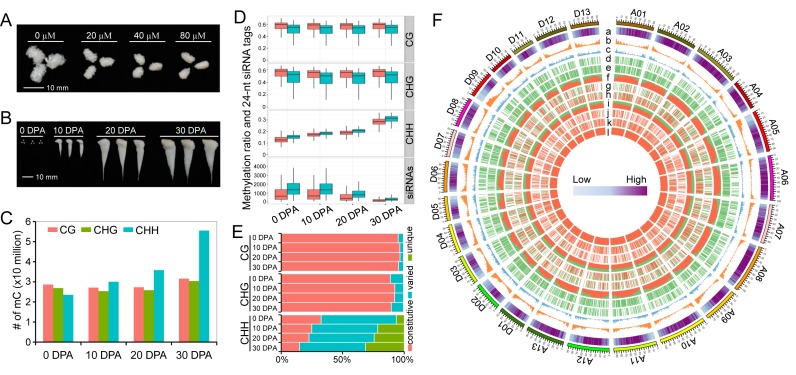
Figure 1.
Identification of methylated cytosines and DNA methylation dynamics during cotton fibre development. (A) Zebularine treatment suppresses fibre development in vitro. This figure shows that 0 day post anthesis (DPA) ovules cultured for 10 days exhibit different fibre lengths. Different concentrations of zebularine (20, 40 and 80 μM) were applied. (B) Samples used for genome-wide methylation profiling. The samples collected from field include ovules at 0 DPA and fibres at 10 DPA, 20 DPA and 30 DPA. (C) Identification of methylated cytosines in each of the four samples. (D) Comparisons of methylation levels and 24-nt siRNAs between At (shown in red boxplots) and Dt (shown in green boxplots) subgenomes. For the calculation of methylation and siRNA levels, chromosomes from the At and Dt subgenomes were divided into 1 Mb windows that slide 200 kb. (E) Comparison of differentially methylated cytosines in CG, CHG and CHH contexts during fibre development. Methylated cytosines that are detected in all the four stages are termed constitutive methylcytosines. Methylated cytosines detected in two or three stages are termed varied cytosines. Methylated cytosines detected in only one stage are termed as unique cytosines. (F) A circos plot shows the methylation dynamics between two consecutive stages. The outer track represents the 26 chromosomes in the G. barbadense genome (A01-A13 of At subgenome and D01-D13 of Dt subgenome). The other histogram tracks represent the TE content (a); the number of protein-coding genes (b); the number of lincRNAs (c); differentially methylated regions (DMRs) between fibres at 10 DPA and ovules at 0 DPA in CG (d), CHG (e) and CHH (f) contexts; DMRs between fibres at 20 DPA and fibres at 10 DPA in CG (g), CHG (h) and CHH (i) contexts; and DMRs between fibres at 30 DPA and fibres at 20 DPA in CG (j), CHG (k) and CHH (l) contexts. The data for each chromosome were analysed in 1 Mb windows sliding 200 kb. For tracks d-l, DMR in each windows was determined as either hypermethylated DMR or hypomethylated DMR in consecutive developmental stages. The ratio of hypermethylated DMRs against hypomethylated DMRs is indicated by the ratio of red against green.

