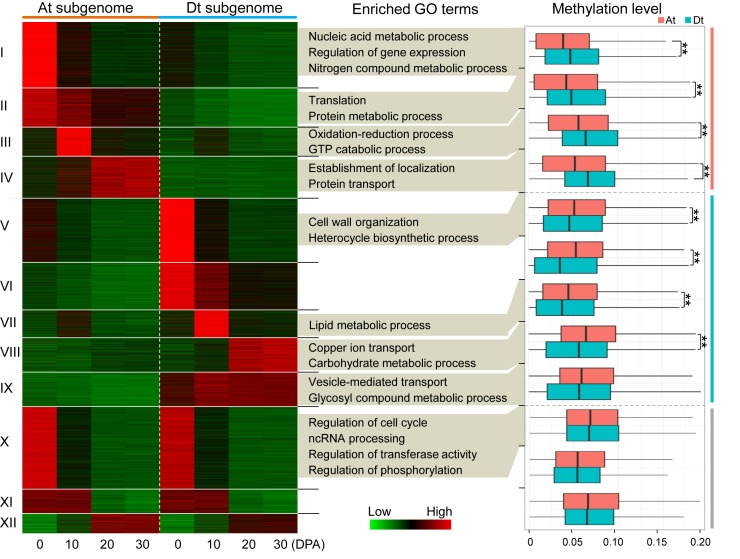
Figure 5.
The relationship between homoeologous gene expression bias and DNA methylation levels. All expressed homoeologous gene pairs between the At and Dt subgenomes were categorized into 12 clusters (I to XII). Gene Ontology (GO) terms with significant enrichment levels were present for each cluster (FDR < 0.01). The methylation levels (upstream 2 kb) of gene pairs between the At and Dt subgenomes were compared and the differentially methylated clusters (I to VIII) were indicated (**P-value < 0.001).

