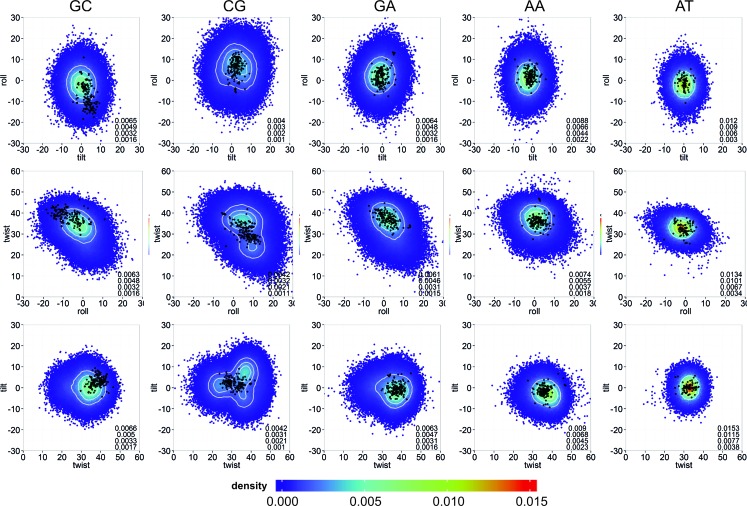
Figure 2.
Comparison at the bps level between the theoretical and experimental rotational spaces. Rotational parameters (tilt, roll and twist) are reported in degrees. All distinct bps found in DDD are shown (removing the ends): GC (first column), CG (second column), GA (third column), AA (fourth column) and AT (fifth column). Smoothed 2D densities, estimated by fitting the observed distributions to a bivariated normal kernel (evaluated on a square grid of 90 × 90 bins), are depicted by coloring the points coming from the MD simulations with a color gradient from low (blue) to high (red) density. Four iso-density curves are shown in white, and are quantified on the bottom right side of each plot. Experimental conformations are shown as black dots (supplementary Table S1).

