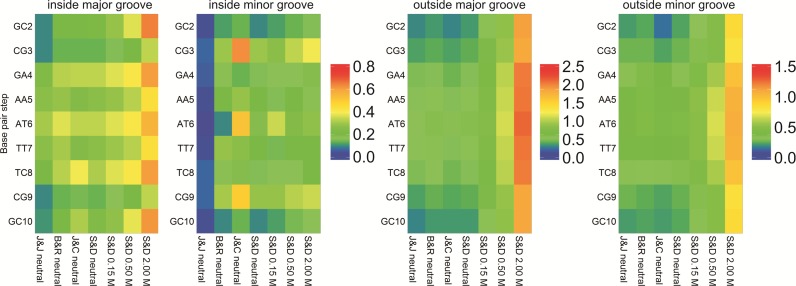
Figure 4.
Average K+ populations inside and outside the DNA grooves. Populations inside the major and the minor groove (left two panels), and outside both grooves (right two panels). The populations were measured for each bps removing the terminal ones (see ‘Materials and Methods’ section). See Supplementary Figure S1 for the CHC partitioning scheme used to divide the grooves.

