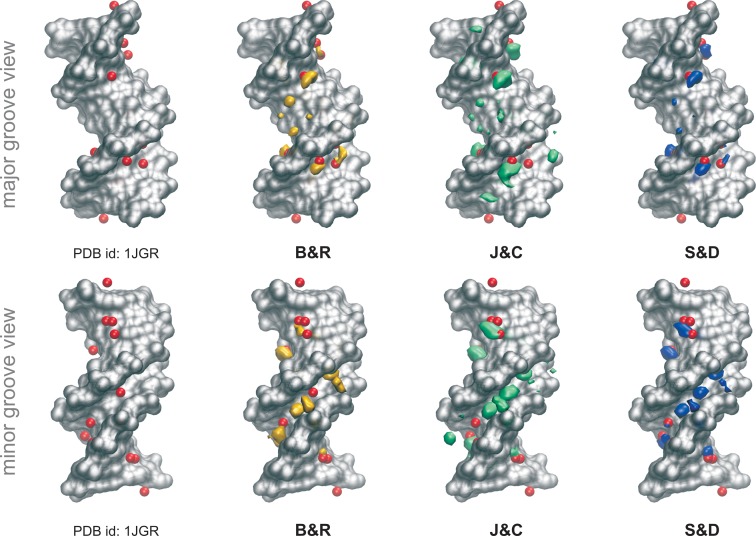
Figure 5.
Potassium distributions along the helix. Cartesian K+ isomolarity surfaces at 5.0 M reconstructed from the CHC histograms with respect to the average structure (shown as a silver surface). For comparison purposes, neutral systems have been overlapped with the Tl+ cations (red spheres) that co-crystallized with the DNA (PDB ID: 1JGR). Note that thallium cations are used as a replacement of potassium in diffraction experiments (1). The distribution with the J&J parameters are not shown since any visible density was observed at 5.0 M concentration.

