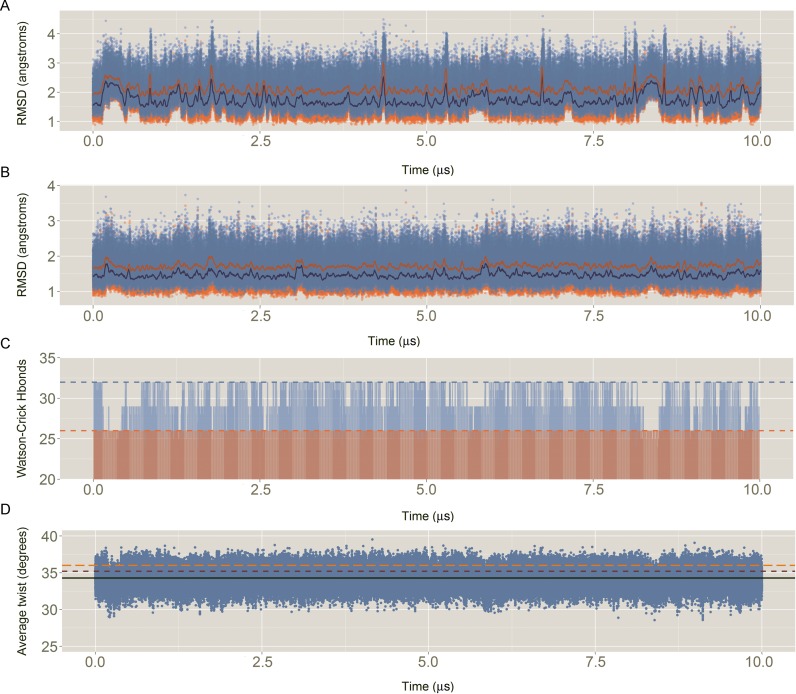
Figure 6.
Descriptors of the quality of the simulation: (A) Root mean square deviation (RMSD) of all the heavy atoms of the Drew–Dickerson dodecamer (DDD) respect to the average experimental value. In blue, RMSD against an average of the X-ray structures (PDB IDs: 1BNA, 2BNA, 7BNA and 9BNA); In orange, RMSD against an average of the NMR ensemble with 5 structures (PDB ID: 1NAJ). For the sake of clarity, running averages every 20 ns are shown in dark orange and dark blue, for X-ray and NMR respectively. (B) Same than (A) but without considering the capping base pairs (i.e. removing all the heavy atoms of base pairs C1:G34 and G12:C13). (C) Evolution of the total number of Watson–Crick hydrogen bonds (Hbonds) with time. Considering a perfect interaction between the 12 bp would lead to a total of 32 Hbonds (light blue dashed line). Without considering the capping base pairs (light red), the ideal total number of Hbonds is 26 (light red dashed line). Hbonds were considered formed if the distance between the donor–acceptor atoms was ≤3.5 Å. (D) Sequence averaged twist for all the base pair steps (bps), excluding the terminals, with time. The average MD value is shown with a black line, while the experimental references are shown in dark red and orange dashed lines, for X-ray and NMR respectively.

