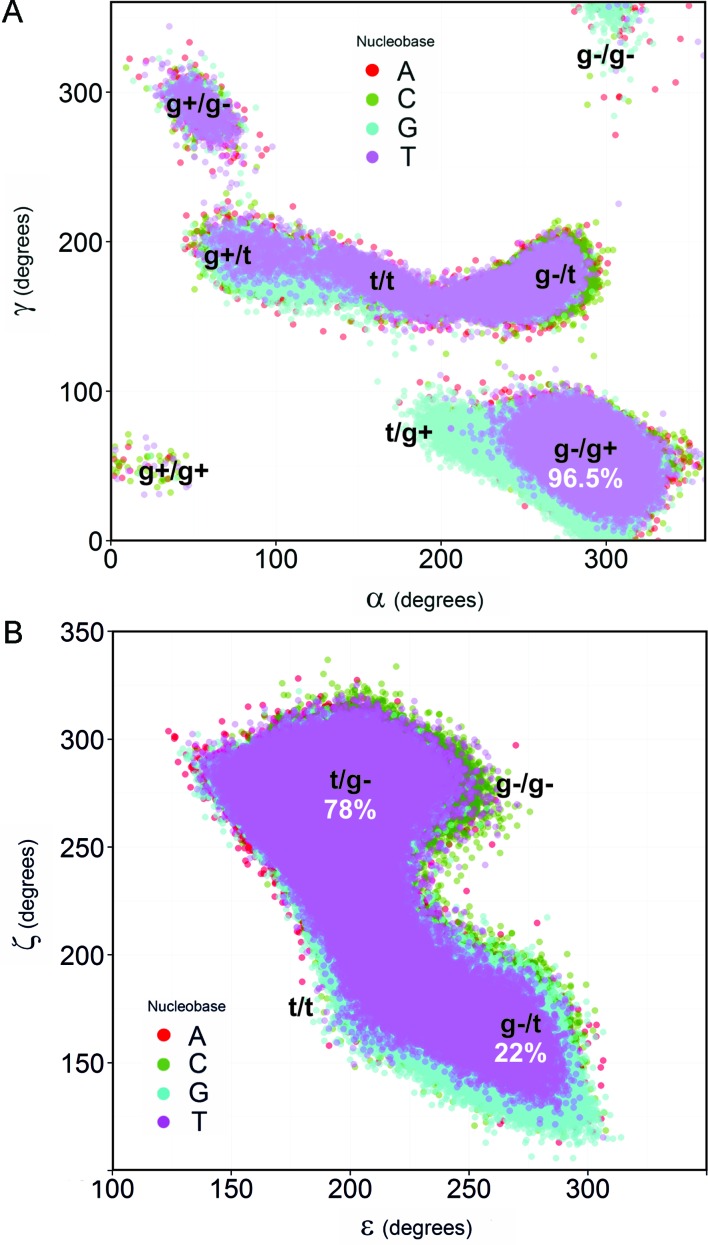
Figure 7.
Major substates of the backbone observed during the simulation of DDD. (A) Scatter plot of α and γ angles grouped by nucleobase. To obtain the distribution of A in the αγ-plane the dynamics of the nucleobases A5 and A6 were considered together (similarly: C3/C9, G4/G10 and T7/T8 were used to build the C, G and T ensembles respectively). (B) Same as (A), but for ϵ and ζ angles. The global percentages (considering both strands) of the major canonical states are shown in white.

