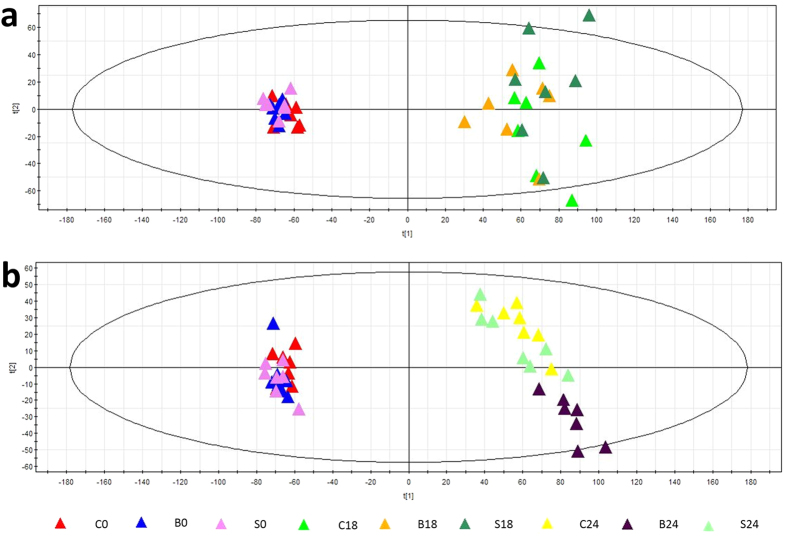
Figure 2. PCA score plots.
(a) The PCA score plot of samples at 0 h and 18 h. The 0 h samples of all three groups (C0, S0, B0) are clustered on the left. The 18 h samples of all three groups (C18, S18, B18) are located on the right, and the 18 h samples of the three groups are intermixed. (b) The PCA score plot of samples at 0 h and 24 h. After treatment (24 h), groups C and S were still intermixed, but group B clustered distinctly from the other two groups in the PCA score plot.

