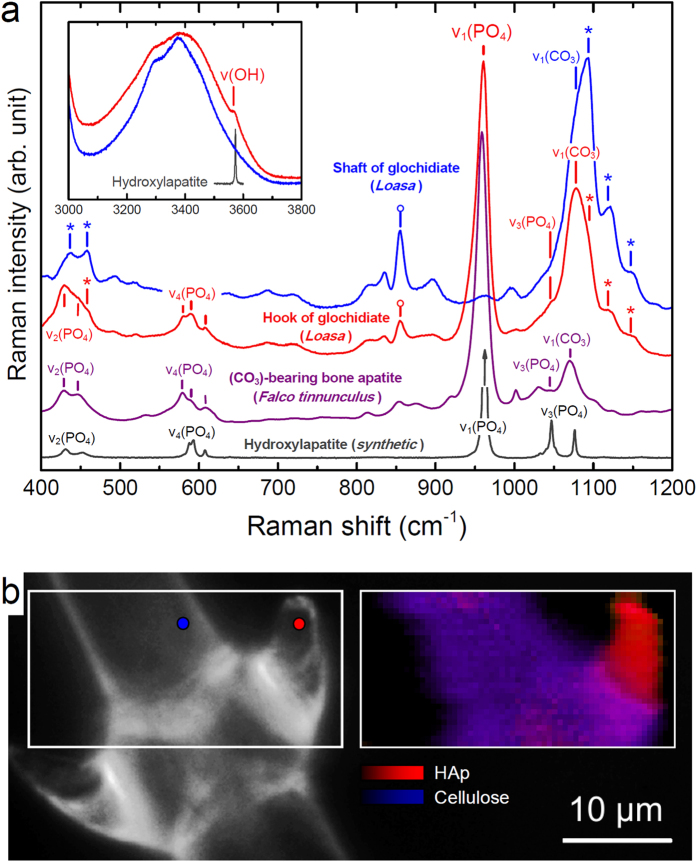
Figure 5. Raman spectra from Loasa trichomes in comparison with reference substances.
(a) Representative Raman spectra from a hook and the shaft of glochidiate trichomes (Loasa) and from synthetic hydroxylapatite (HAp) and carbonated bone apatite. Location of spectra is shown in (b). Spectra were normalized with respect to the strongest band in the spectral range. Note the perfect agreement of the observed frequency and width of the internal [PO4] bands, including the intense symmetric ν1(PO4) stretching band near 958 cm−1, in the spectrum of the hook with those in the spectrum of carbonated bone apatite (=959 cm−1), which is clear evidence for nanocrystalline apatite in the trichome. The visible spectral differences are mainly related to the different organic environment. In bone apatite the Raman bands are partly convoluted with bands from collagen, whereas in the spectra from glochidiate trichomes the apatite bands are partly overlain by bands from cellulose and pectin, some of which are marked in the figure by (*) and (o), respectively. Note the occurrence of a band in the OH region in the spectrum from the hook (inset diagram) near 3566 cm−1 that is located on the top of the O-H stretching bands of cellulose. Although this band is much broader than the OH band of synthetic HAp near 3573 cm−1, it is only visible in spectra showing the strong ν1(PO4) band near 958 cm−1. It thus further identifies the apatite as hydroxylated apatite. Additionally, a band near 1078 cm−1 that is overlain be the strong cellulose band near 1093 cm−1 is detected. This band is likely related to the symmetric ν1(CO3) stretching mode of the carbonate molecule. (b) Optical image of hooks on a glochidiate trichome of Loasa (left) and corresponding false-color hyperspectral Raman image (right), showing the concentration of nanocrystalline hydroxylated apatite inside the hooks. The image was color-coded according to the integrated intensity of the v1(PO4) band and the sum of the integrated intensity of the cellulose bands near 1090, 1120, and 1155 cm−1. Raman spectra shown in (a) where taken from locations marked by colored circles in the optical image.

