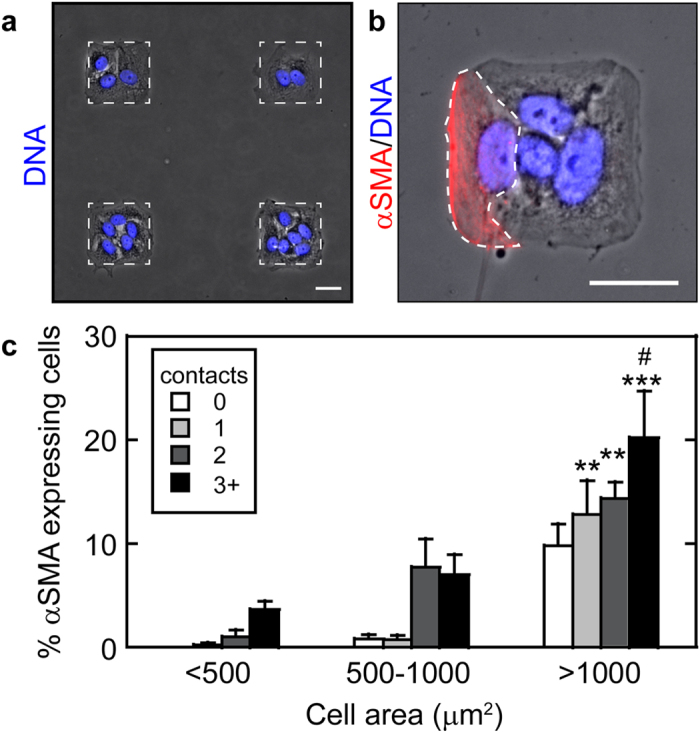
Figure 2. TGFβ1-induced alpha smooth muscle actin expression increases with cell spread area and cell-cell interactions.

(a) Array of micropatterned NMuMG cells cultured on fibronectin islands. Protein islands are outlined by a white dotted line. (b) Square NMuMG epithelial tissue demonstrating cell area, number of contacting neighbors, and αSMA expression. A single cell expressing αSMA is outlined by a white dotted line. Scale bars: 25 μm. (c) Percentage of NMuMG cells expressing αSMA as a function of cell area and number of neighboring cells following treatment with TGFβ1. #p < 0.05 compared to >1000 μm2, 0 contact. **p < 0.005, ***p < 0.0001 compared to <500 μm2, 0 contact.
