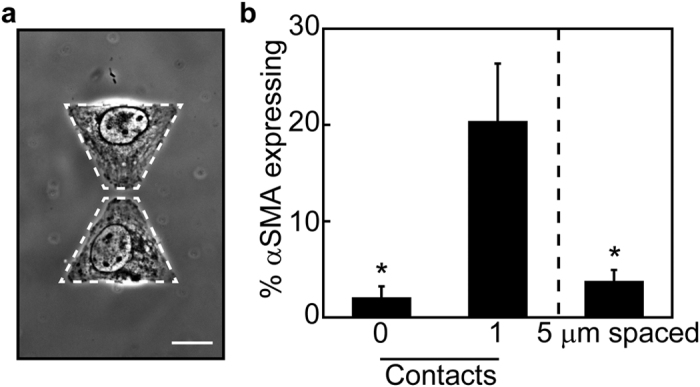
Figure 4. Paracrine signaling is not responsible for increased αSMA expression.

(a) Phase contrast image of NMuMG cells cultured on 1600 μm2/cell triangular islands separated by 5 μm. Scale bar: 20 μm. (b) Percentage of single (0 contact), doublet (1 contact), and 5 μm separated NMuMG cells expressing αSMA with TGFβ1 treatment. *p < 0.05 compared to doublet (1 contact) cells.
