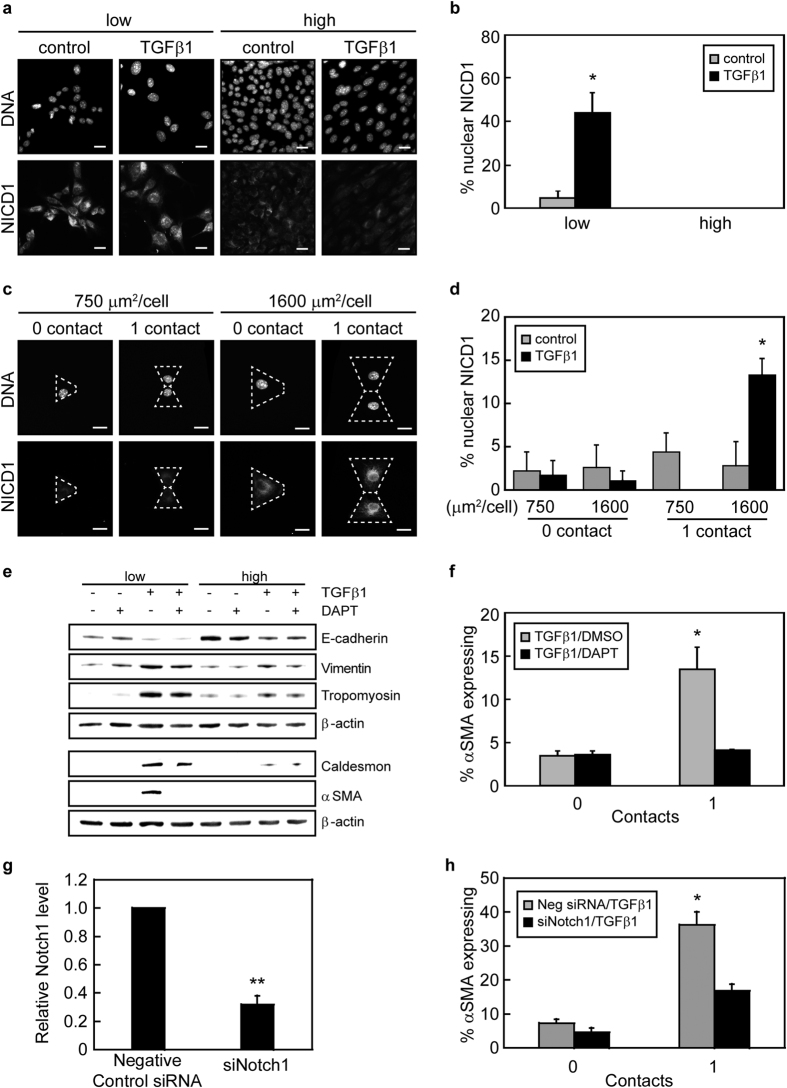
Figure 5. Cell-cell contact and cell-matrix adhesion together regulate αSMA expression via the Notch1 signaling pathway.
(a) Fluorescence microscopy images of NICD1 localization in cells seeded at low and high densities with and without TGFβ1. Scale bars: 20 μm. (b) Quantification of the percentage of cells with nuclear NICD1 as a function of seeding density. *p < 0.05 compared to all samples. (c) Fluorescence microscopy images of NICD1 localization in TGFβ1-treated NMuMG cells cultured on micropatterned triangular and bowtie shaped islands. Dotted white lines outline an individual cell. Scale bars: 20 μm. (d) Quantification of the percentage of cells with nuclear NICD1 as a function of cell spread area and number of neighboring cells. *p < 0.05 compared to all samples. (e) Western blot analysis of EMT markers for cells seeded at low (5,000 cells/cm2) and high (100,000 cells/cm2) densities with and without TGFβ1 and DMSO control vehicle or γ-secretase inhibitor DAPT. (f) Percentage of NMuMG cells with a cell spread area of 1600 μm2 expressing αSMA on triangular (0 contact) and bowtie (1 contact) islands following treatment with TGFβ1 and DMSO control vehicle or γ-secretase inhibitor DAPT. *p < 0.05 compared to all samples. (g) Transcript levels of Notch1 for cells transfected with siRNA. **p < 0.01 compared to negative control siRNA. (h) Percentage of NMuMG cells transfected with siRNA targeting Notch1 with a cell spread area of 1600 μm2 expressing αSMA on triangular (0 contact) and bowtie (1 contact) islands following treatment with TGFβ1. *p < 0.05 compared to all samples.

