
Figure 2.
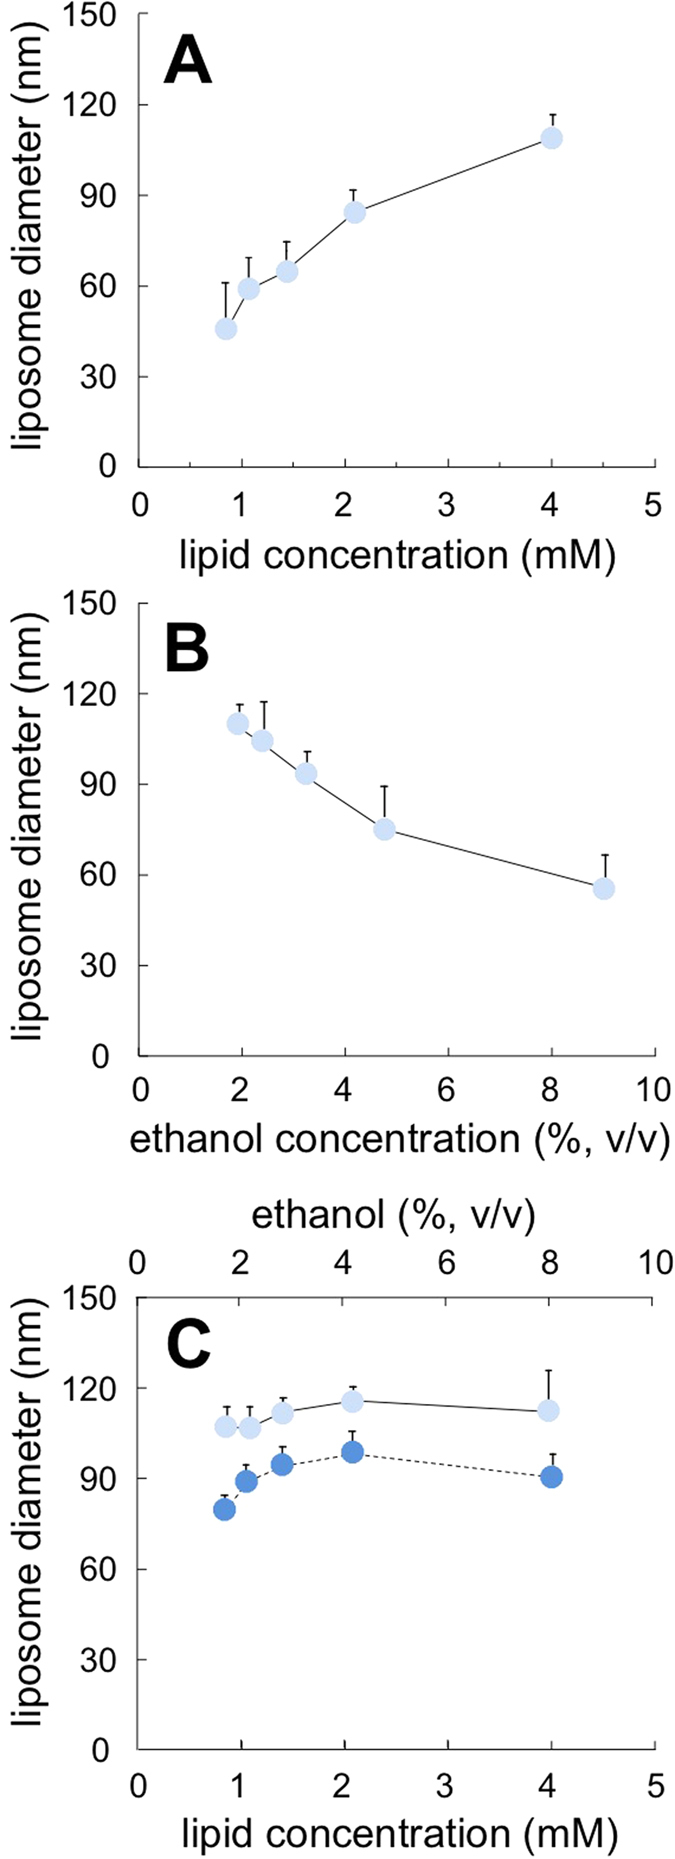
Effect of the variation of lipid concentration (A), ethanol content (B) and simultaneous variation of both parameters (C) on the dimension of liposomes produced by ethanol injection. For comparison, data relative to liposomes prepared by MHF microfluidics are also reported in panel C (dashed line). Data correspond to the Z-average, determined by DLS. Liposomes were constituted of PC/cholesterol 4.0−0.4 mM, and data represent the mean of three independent samples, measured in triplicate ± S.D.