
Figure 4. Comparative analysis of liposomes produced by microfluidic technique with different microchips.
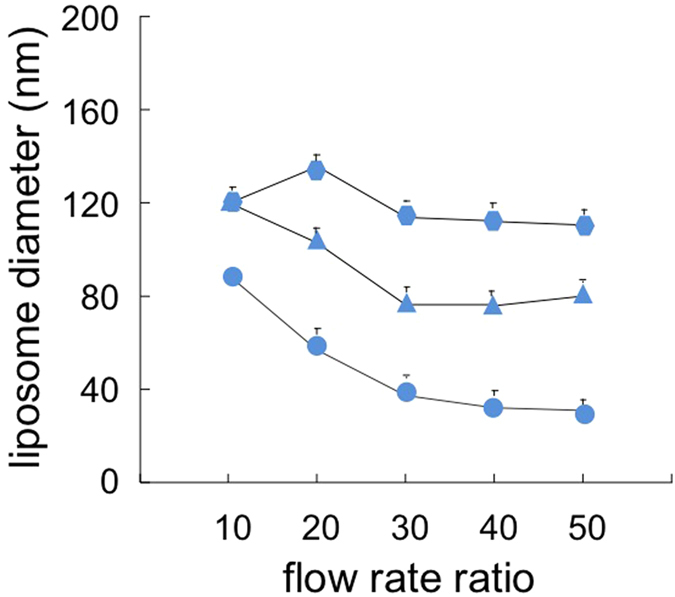
Data refer to Z-average of liposomes produced by #chip1-MHF (circles), #chip2-YJ (hexagons) or #chip3-PM (triangles). Liposomes were constituted of PC/DDAB 9.0−1.0 mM, produced at the indicated FRR and TFR = 37.50 μl/min. Data are reported as the mean of three independent samples, measured in triplicate ± S.D.