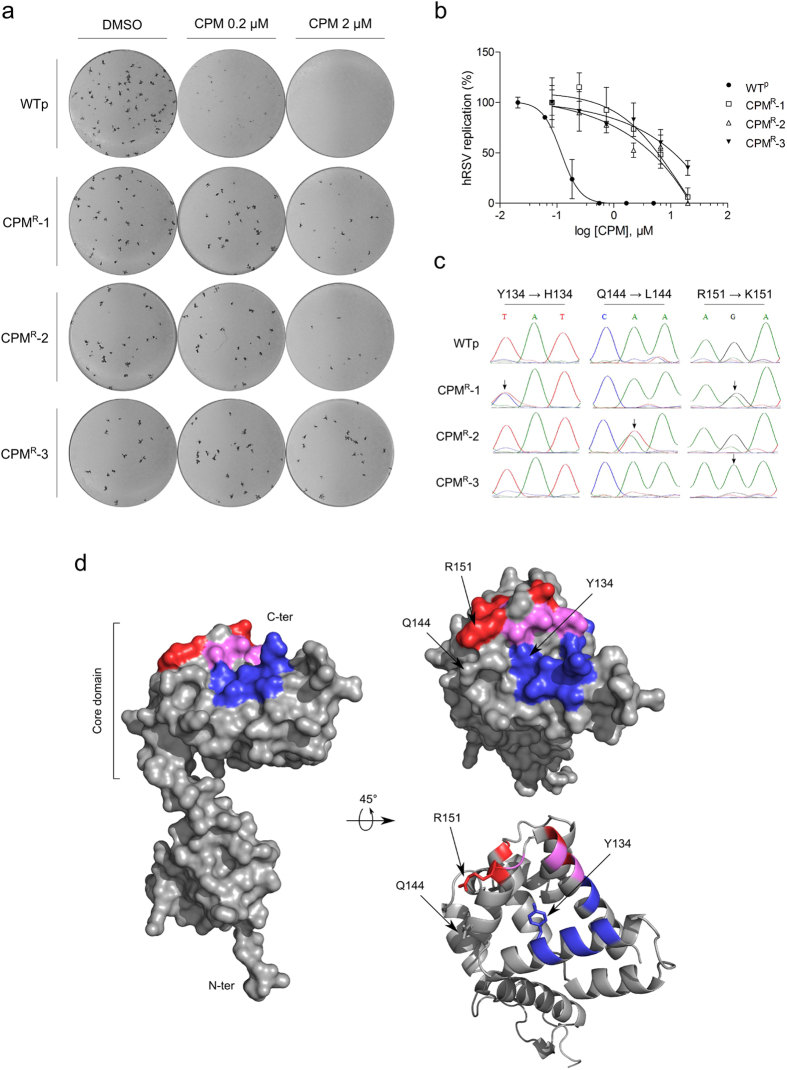
Figure 3. hRSV mutants resistant to CPM.
(a) Comparison of the focus formation by CPM-resistant viruses CPMR-1, CPMR-2, CPMR-3, and a passaged-wild-type virus (WTp) on HEp-2 cells in the presence or absence of CPM. (b) Dose-response of CPM on the 3 resistant mutants and WTp, measured by focus reduction assay on HEp-2 cells. The compound in (a,b) was applied post-adsorption, for 72 h. The average size of foci, measured using the software Fiji57, was normalized as percentage of the untreated control. The mean of duplicated values are plotted, along with the SEM represented by the error bars. The results are representative of 3 independent experiments. (c) Sequencing chromatograms of WTp and the 3 resistant virus supernatants, showing the base changes and amino-acid substitutions. The black arrows indicate the sites of clear mutation. (d) Mapping of the three mutation sites on a monomeric M2-1. Left: Surface representation of a full-length M2-1. Right: Surface (top) and cartoon (bottom) representations of the C-terminal side of M2-1 core domain. The RNA and P binding sites described by Blondot et al.21 are colored in red and blue respectively. The amino-acids that belong to both binding sites are colored in magenta. The three sites of mutation are indicated with black arrows. The models (PDB accession code 4C3B) were rendered using the PyMOL Molecular Graphics System, Version 1.7.1.0, Schrödinger, LLC.

