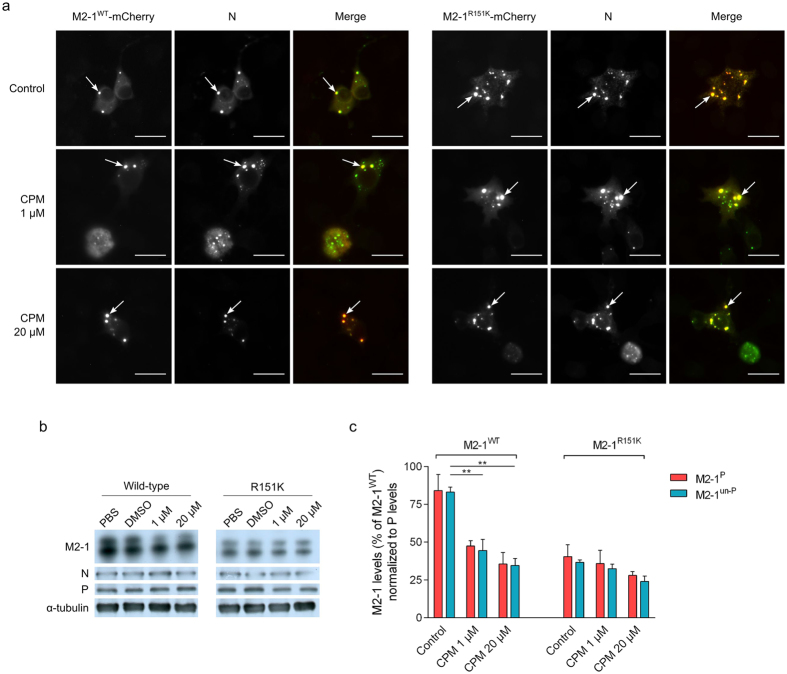
Figure 5. Effect of CPM on M2-1 expression.
(a) Immuno-fluorescence labelling of N and direct fluorescence of M2-1WT-mCherry or M2-1R151K-mCherry in minigenome-transfected BSR-T7/5 cells. Transfected cells were treated for 24 h with either DMSO or the indicated concentrations of CPM. N (green) was visualized using a mouse monoclonal anti-N primary antibody. Scale bars: 20 μm. The white arrows point to the location of cytoplasmic inclusion bodies. Merged images were created using the software Fiji. (b) Expression of M2-1, P, N and α-tubulin in minigenome-transfected BSR-T7/5 cells with the indicated concentrations of CPM, using M2-1WT or M2-1R151K, resolved by SDS-PAGE 24 h post-transfection and revealed by Western-blot using rabbit polyclonal anti-M2-1, P and N and mouse monoclonal anti-α-tubulin antibodies. Levels of α-tubulin are shown as a control of protein expression and DMSO served as control. The results are representative of 3 independent experiments (c) Associated levels of phosphorylated (M2-1P) and unphosphorylated (M2-1un-P) M2-1WT or M2-1R151K, normalized to levels of P in the absence of CPM or DMSO, and expressed as a percentage of M2-1WT in the absence of CPM. Proteins levels were measured from western blots using a GeneGnome Digital Imager (Syngene, Frederick, MD, USA). Bars are the mean of 3 independent experiments ± SEM. **p < 0.01 (Two-tailed t-test).

