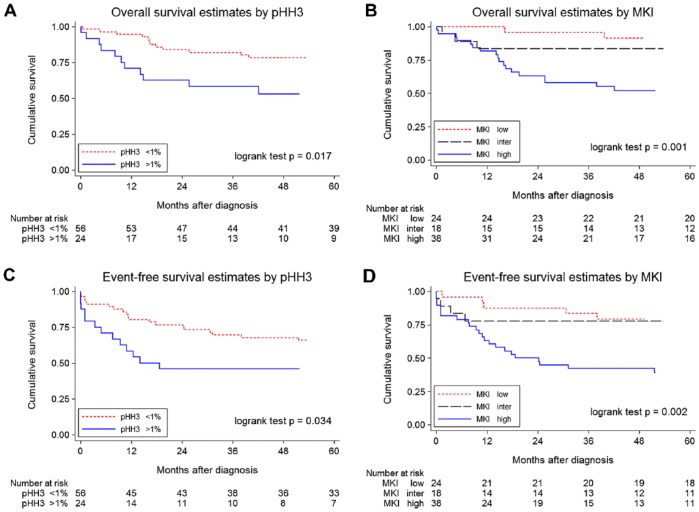
Figure 2.
Kaplan–Meier survival curves for phosphohistone H3 (pHH3) proliferation indices (pHH3-PIs) and mitosis karyorrhexis index (MKI) in neuroblastomas (NBs) in the entire cohort (n=80). (A) Overall survival (OS) of patients with NBs dichotomized at the 1% threshold for pHH3-PIs. (B) OS of patients with NBs with low, inter, intermediate and high MKIs. (C) Event-free survival (EFS) of patients with NBs dichotomized at the 1% threshold for pHH3-PIs. (D) EFS of patients with NBs with low, inter, intermediate and high MKIs.

