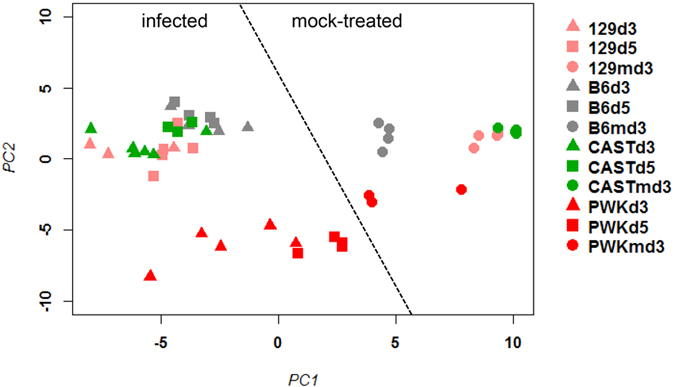
Figure 2. PCA analysis of gene signature expression values in the blood of CC founder mice.

Principle component analysis (PCA) was performed with normalized log2–transformed gene expression values for the mouse orthologues (Table S2) of the human signature genes (omitting XIST) after IAV infection with 10 FFU H3N2 of mice from four CC founder strains6. Horizontal and vertical axis represent principle component 1 and 2, respectively. The first two principal components represent 54% and 17%, respectively, of the total variation. Dots represent individual samples from controls at day 3 post treatments (labelled md3) or infected mice. Colors represent the different mouse strains. Symbols represent controls and different times p.i.
