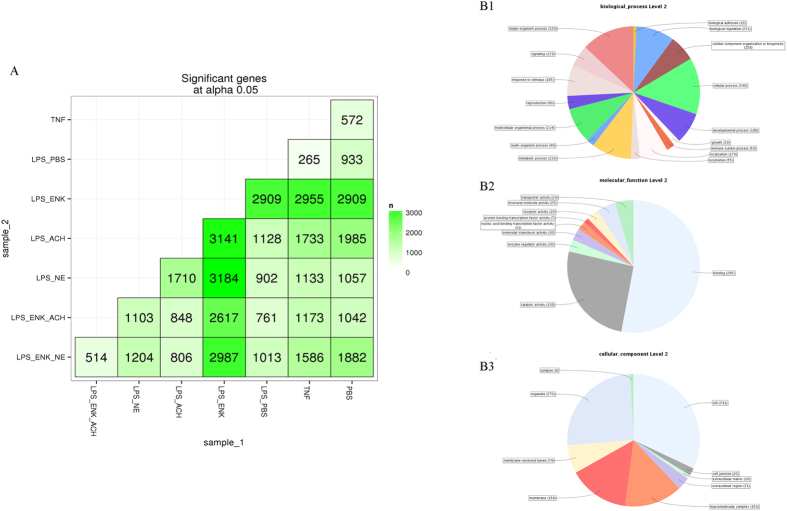
Figure 1. The overall expression level of all the genes and the differentially expressed genes between control and experiment groups.
(A) The matrix of differentially expressed genes between any two groups. (B) Sequence distribution by GO at level 2 for differentially expressed genes between the TNF and PBS groups (B1: Biological process; B2: Molecular function; B3: Cellular component). Numbers shown in the chart represented the amount of sequences with corresponding GO terms.

