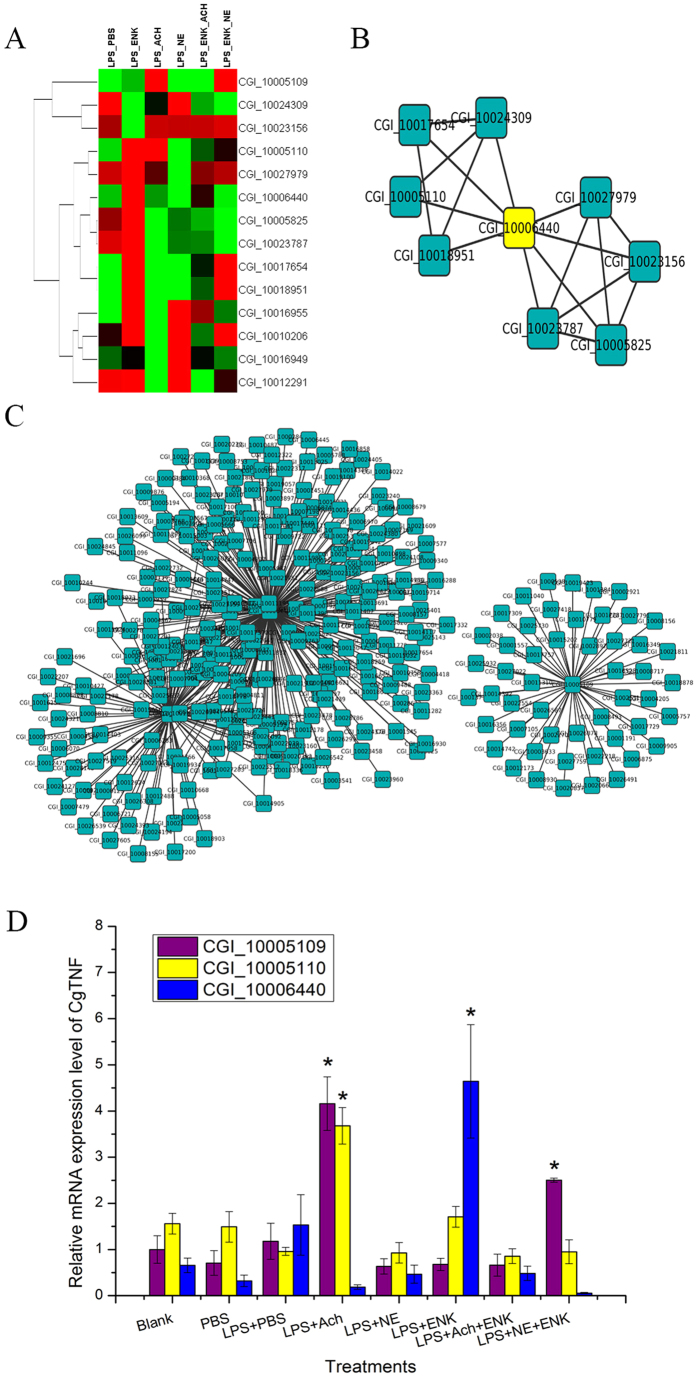
Figure 5. The expression pattern of cytokines and transcription factors after neurotransmitter treatment.
(A) Fourteen differentially expressed genes in the TNF, NF-κB and AP-1 pathway and their expression level in the six groups. (B) The network that shows the internal connectivity among the 14 genes in the turquoise module. (C) The co-expression network of 3 TNF genes indicates their direct connectivity with other immune-related genes. (D) The relative mRNA expression level of 3 TNF genes in the eight groups.

