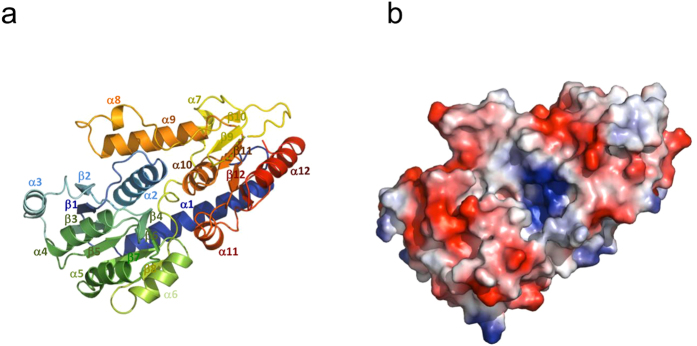
Figure 3. Overall structure of Pvg1p.
Structure of Pvg1p is displayed using (a) ribbon and (b) electrostatic surface models. (a) In the ribbon model, N- and C-terminal regions are shown in blue and red, respectively. (b) In the electrostatic surface model, positive and negative charges are depicted in blue and red, respectively.

