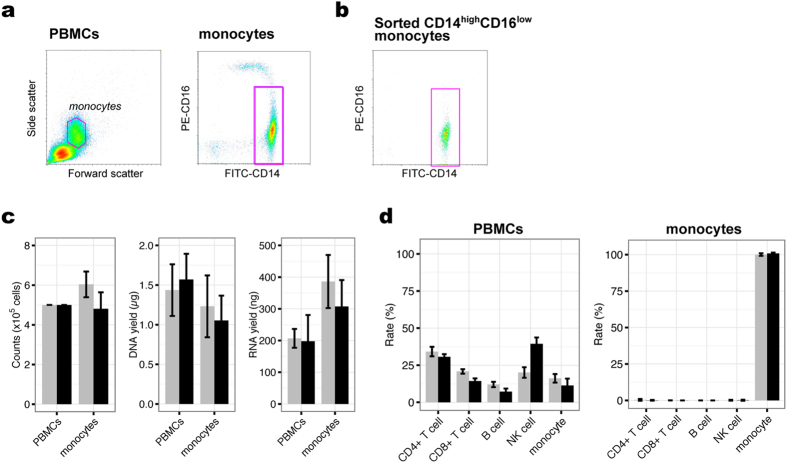
Figure 2. Sample summaries.
(a) Monocyte gating strategy. Typical light-scatter density-plot of PBMCs (left) and CD14highCD16low monocytes were isolated from the monocyte-containing gate based on CD14 and CD16 expression (right). (b) Isolated CD14highCD16low monocyte population (96.7% ± 1.0% purity). (c) Cell numbers (left) and DNA (middle) and RNA (right) yields obtained for each cell population. (d) Estimated cellular composition for each sample as determined by reference information on cell-specific DNA methylation signatures using the “estimateCellCounts” function implemented in the minfi package. Bars in (c,d) represent mean ± standard deviation (grey, participant #1; black, participant #2).

