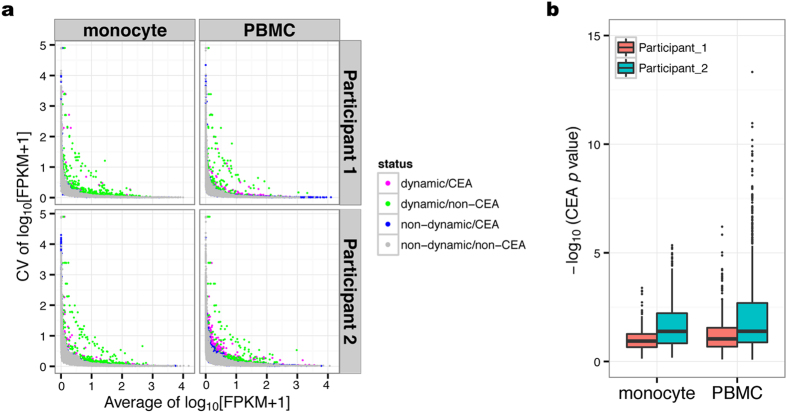
Figure 3. Extraction of dynamically expressed genes.
(a) Dynamically expressed genes were defined as coefficient of variation (CV) outliers for each gene with 0.05-interval bins of the average of log10 [FPKM + 1]. (b) Association analysis between cell-type composition and variation in the expression of dynamically expressed genes in each cell population. The vertical axis shows the distribution of the negative log10 (p values) obtained from linear regression and ANOVA testing.

