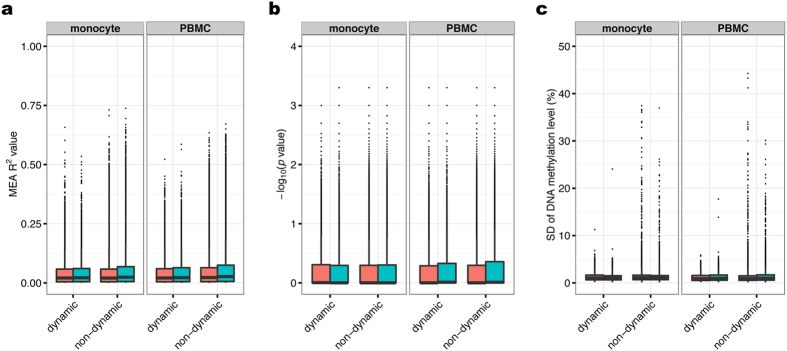
Figure 4. Contribution of DNA methylation to gene expression.
(a) The distribution of the R2 values—representing the proportion of gene expression variation due to DNA methylation—was computed by linear regression analysis. (b) The distribution of negative log10 (p values) obtained from Spearman’s rank correlation and permutation test. (c) The standard deviation distribution for DNA methylation at each CpG site near the dynamic non-CEA genes. (a,b) All FPKM and beta values were converted to relative values using the values of Day 1 as a reference.

