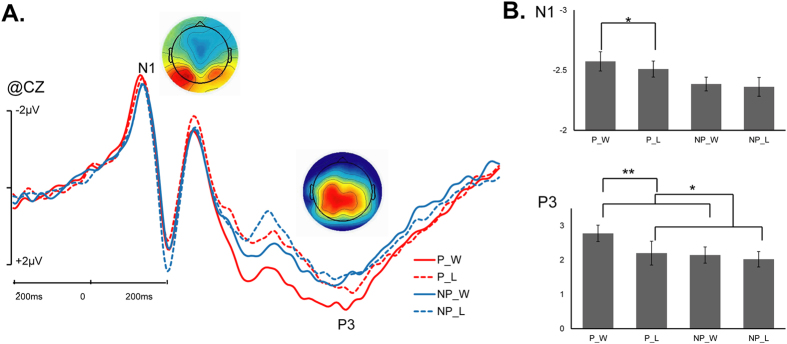
Figure 3. Cortical responses to picture stimuli.
(A) ERPs elicited by the painful and non-painful pictures indicating win and lose at CZ site. The voltage topographies illustrate the scalp distribution of each component; (B) the averaged amplitudes within the N1 and P3 time Window in each conditions (P_W: Painful picture and Win; P_L: Painful picture and Lose; NP_W: Non-painful picture and Win; NP_L: Non-painful picture and Lose) (**p < 0.01; *p < 0.05).

