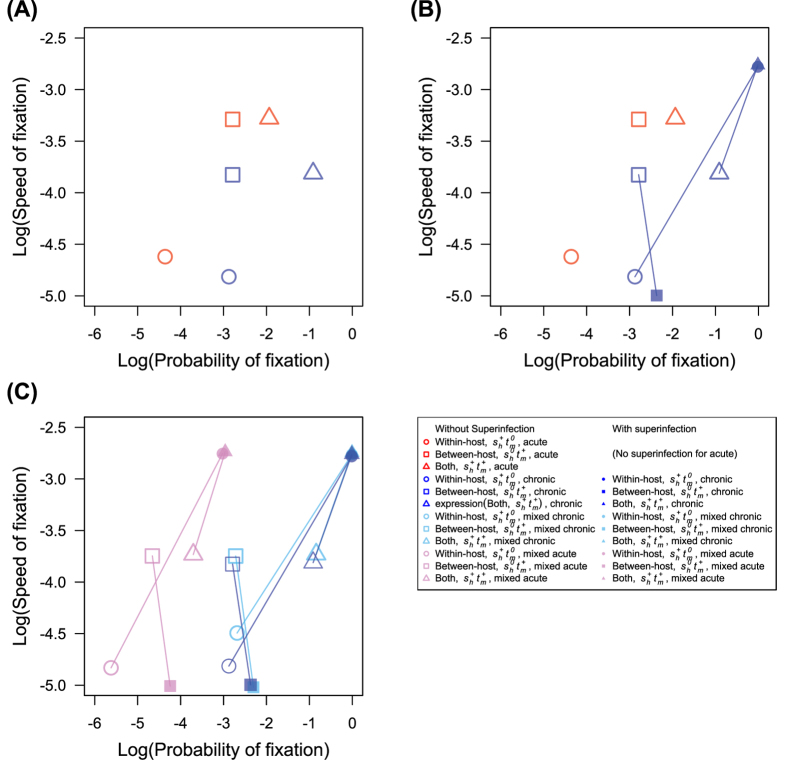
Figure 4. The probability of fixation and the speed of fixation.
The speed of fixation is equal to the inverse of the time to fixation. This plot is shown in log-log scale. (A) Chronic infections (blue symbols) have higher probability of fixation (except for the between host sh0tm+ model) while acute infections (red symbols) have higher speed of fixation. (B) Superinfection (filled symbols) greatly increases both the probability and the speed of fixation in chronic models containing within-host advantage but not between-host disadvantage (sh+tm0 and sh+tm+), while decreasing speed of fixation and increasing probability of fixation in between-host model (sh0tm+). Identical model types with and without superinfection are joined by a line. (C) The mixed model, with both acute and chronic infections in the same population, increases both speed of and probability of fixation of mutations occurring in chronic infections (the values shown here are from the mixed model with 50% chronic infections). The effect of superinfection in the mixed model is similar to that in the chronic-infection only model. Pink and cyan indicate the mixed model with a beneficial mutation occurring in acute and chronic patients, respectively.

