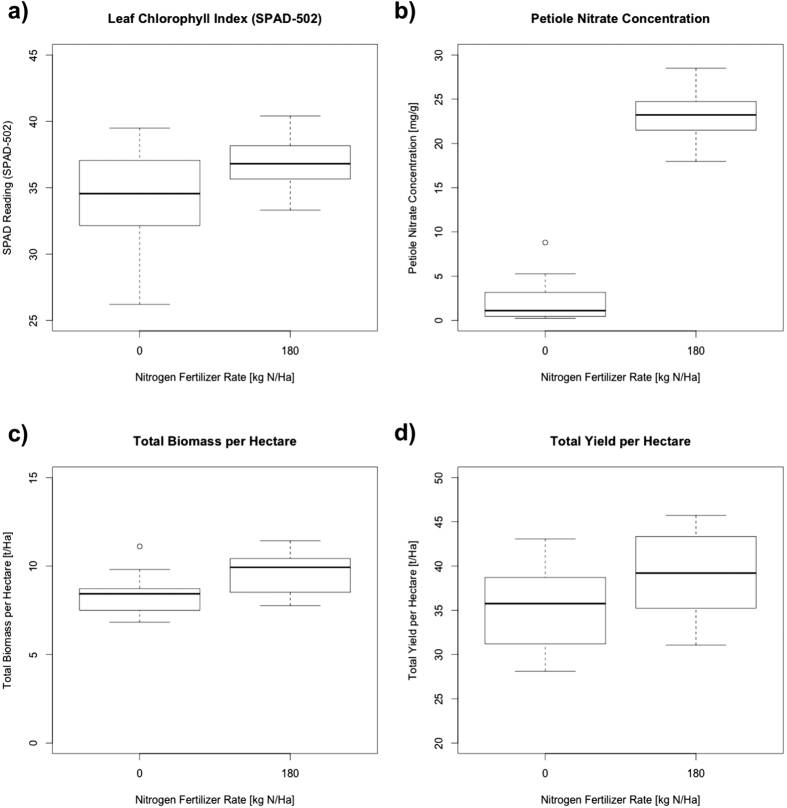
Figure 1. Comparison of four phenotypic traits in potato plants grown at two different N supplementation rates.
Plots are showing different phenotypic measurements in potato plants from three cultivars (Shepody, Russet Burbank and Atlantic) grown at two rates of N supplementation (0 kg N ha−1 and 180 kg N ha−1). In all cases, plants with no N supplementation display signs of N deficiency and early senescence. (a) Relative leaf chlorophyll content measured by light transmittance using a SPAD-502 meter. (b) Petiole nitrate concentration measured colorimetrically. (c) Total plant biomass, measured from plant components (tubers, vines, stolons plus readily recoverable roots) for a representative sample of plants. (d) Total fresh tuber yield in the field from a representative sample of plants.

