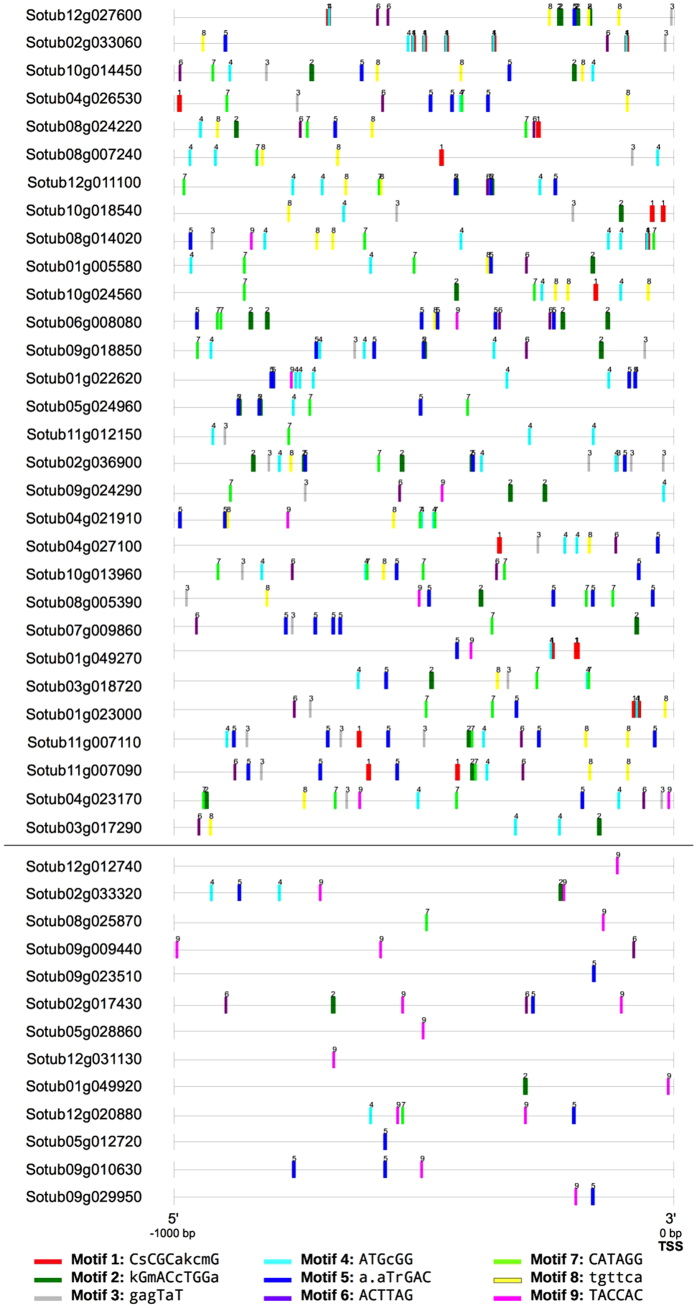
Figure 3. Motif locations in the 5′-upstream flanking region of N responsive genes.
Diagrams representing the 1000 bp 5′-upstream region of the 30 over-expressed (top section) and 13 under-expressed (bottom section) N responsive genes. Coloured rectangles indicate an instance of a discovered motif in that position; one-letter representations of every motif are found in the diagram key at the bottom. The Transcription Start Site (TSS) of every gene is located at the right end of each upstream flanking region.

