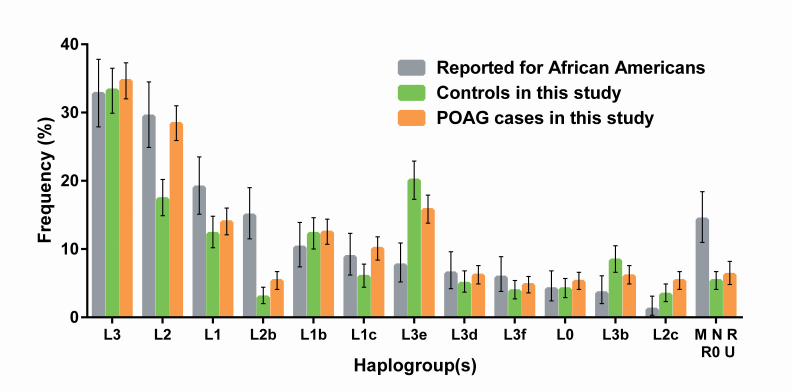
Figure 3.
The distribution of major mtDNA haplogroups inferred for the POAAGG study population is consistent with African-American ancestry. For POAAGG subjects, the frequency of each haplogroup was estimated by the mean variance frequency from a set of associated positions on mtDNA by Pool-seq. The estimates for POAG cases (orange bars) and controls (green bars) are compared to those from an independent multicenter study of African-American haplogroups (gray bars). Error bars represent 95% confidence intervals.

