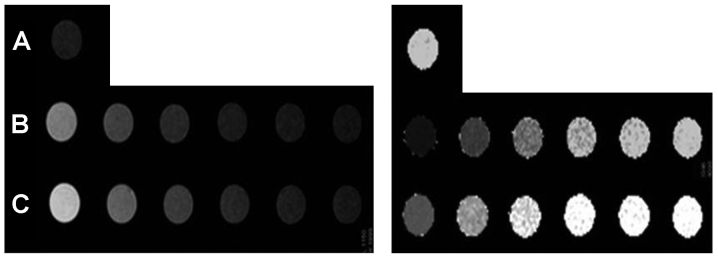
Figure 5.
T1-weighted images (left) and T1-map images (right) of different gadolinium (Gd) concentration of anti-epidermal growth factor receptor-internalizing arginine-glycine-aspartic acid-diethylene triamine pentaacetate-Gd (anti-EGFR-iRGD-DTPA-Gd) and Gd-DTPA. The concentration of Gd was 77, 38.4, 19.2 9.6, 4.8 and 2.4 µM, respectively. (A) Saline, (B) anti-EGFR-iRGD-DTPA-Gd and (C) DTPA-Gd.

