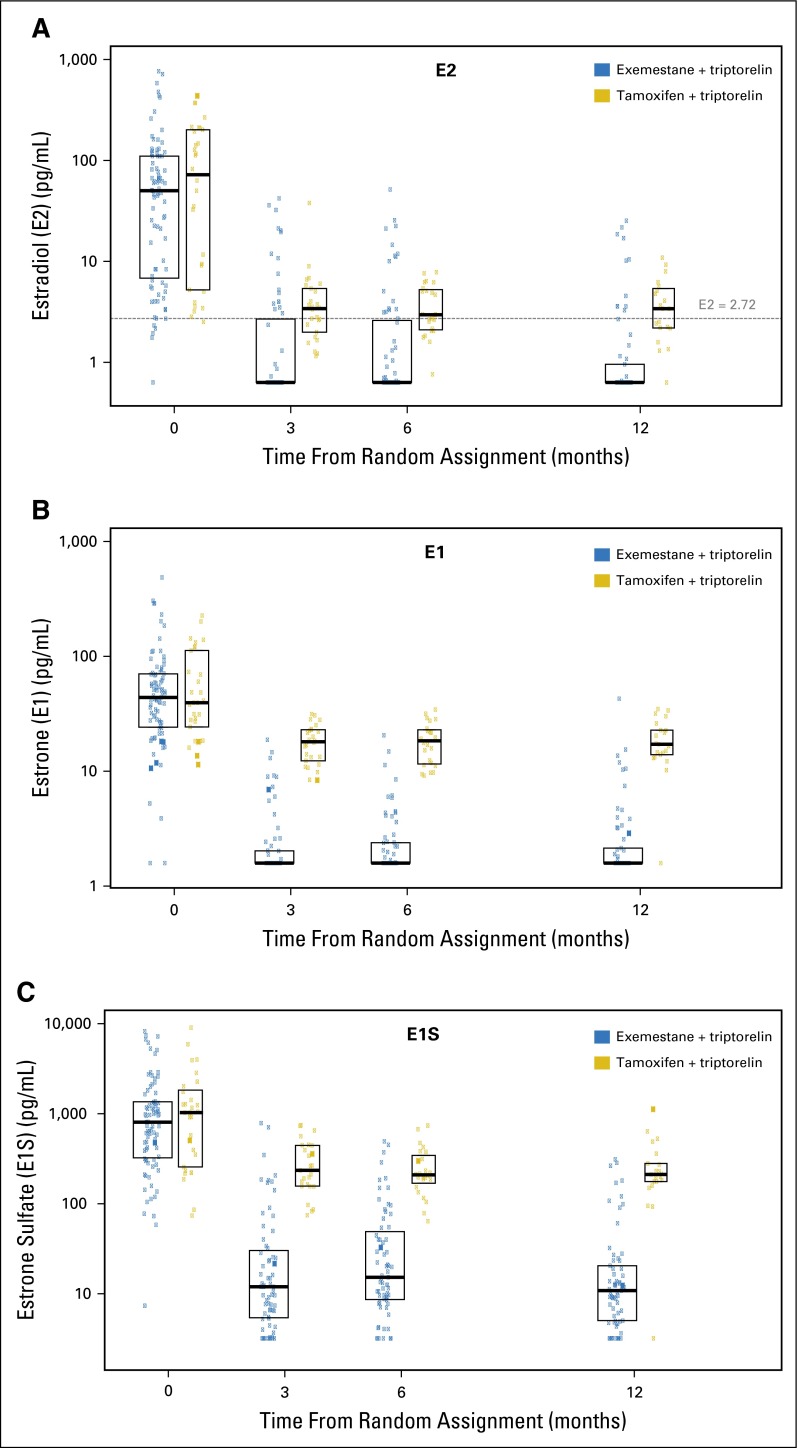
Fig 2.
Distributions of (A) estradiol (E2), (B) estrone (E1), and (C) estrone sulfate (E1S) over time according to treatment assignment. Boxes indicate the 25th, 50th, and 75th percentiles. (A) The horizontal dashed line indicates the threshold of 2.72 pg/mL. Levels were significantly different at each postbaseline time point (each P < .001).

