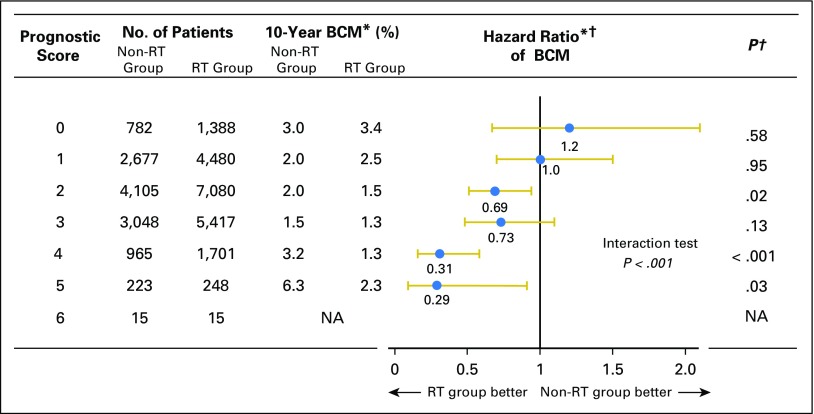
Fig 2.
Hazard ratio comparing breast cancer mortality (BCM) between radiotherapy (RT) group and non-RT group according to prognostic score. (*) Weighted by inverse propensity score. (†) Multivariate analysis adjusted by age of patients, year of diagnosis, race, tumor size, nuclear grade, and marital status. NA, not applicable.

