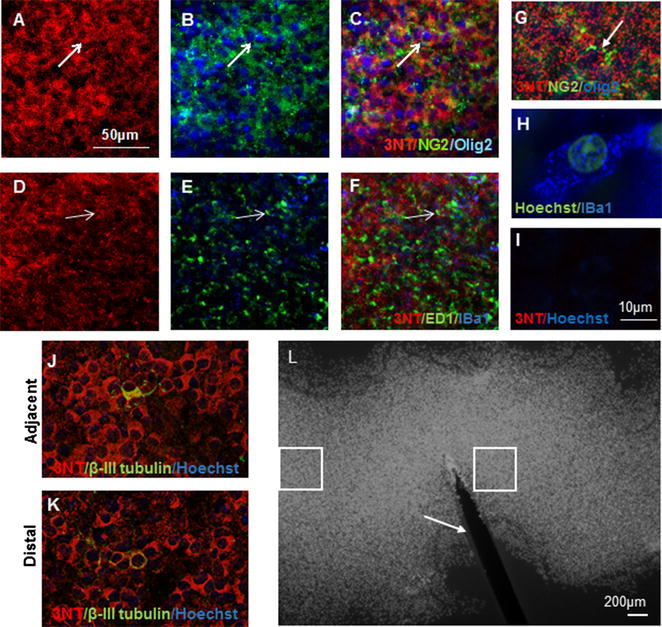
Fig. 2.

Representative images of 3NT immunoreactivity (A, D), colocalised with some NG2/Olig2 + ve cells (B, arrow) with overlay (C), and some ED1/IBA1− +ve cells (E, arrow) with overlay (F). Higher magnification images of NG2/Olig2+ (G) and IBA+ (H) cells are provided, together with a control image omitting the 3NT primary antibody (I). 3NT immunoreactivity was approximately equivalent both adjacent to the cut injury (J) and more distally (K); 3NT (red), β-III tubulin (green), Hoechst nuclear stain (blue). Scale = 50 µm for images A–F, J, K; scale = 10 µm for G–I. A representative image of a spinal cord slice with cut injury, stained with Hoechst nuclear stain (L); boxed areas indicate analysis sites close and distal from the injury (indicated by an arrow), scale = 200 µm
