Fig. 3.

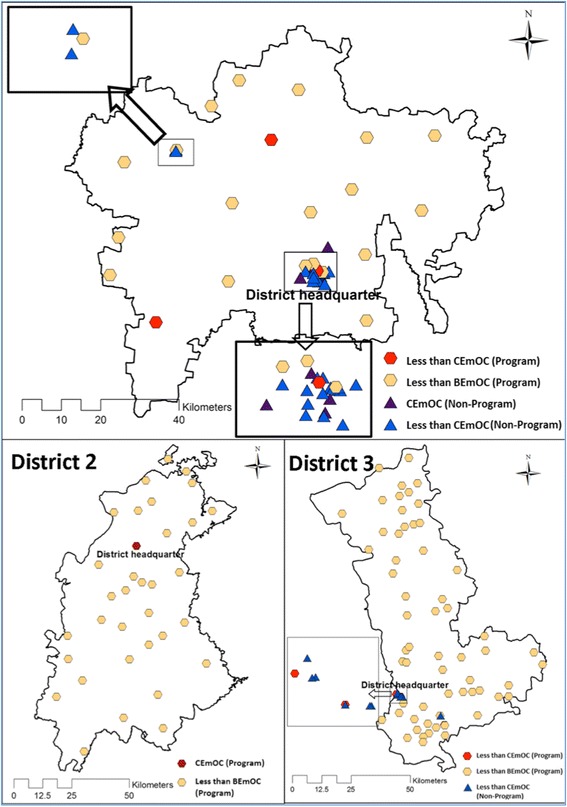
Performance of EmOC signal functions in programme and non-programme facilities in the study districts. The map depicted in Fig. 1 has been developed by the study team

Performance of EmOC signal functions in programme and non-programme facilities in the study districts. The map depicted in Fig. 1 has been developed by the study team