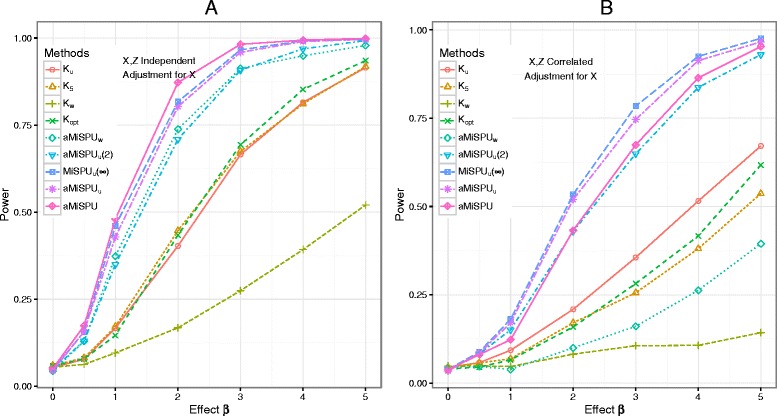
Fig. 3.

Type I error and power comparison for scenario 2 with a binary outcome. A selected phylogenetic cluster (0.35 %) of the OTUs was associated with the outcome. X and Z are independent (a) or correlated (b). K u, K w, and K 5 represent MiRKAT results from the unweighted UniFrac kernel, weighted UniFrac kernel, and generalized UniFrac kernels with α=0.5, respectively. K opt represents the simulation results for optimal MiRKAT considering the Bray–Curtis kernel, unweighted UniFrac kernel, weighted UniFrac kernel, and generalized UniFrac kernel. MiSPUu(2), MiSPUu(∞), and aMiSPUu represent the MiSPUu test with γ=2,∞ and aMiSPUu summarizing γ=2,3,…,8,∞, respectively. aMiSPUw and aMiSPU represent the test summarizing γ=2,3,…,8,∞ with weighted generalized taxon proportion and combining aMiSPUu and aMiSPUw, respectively. Results were presented at n=100
