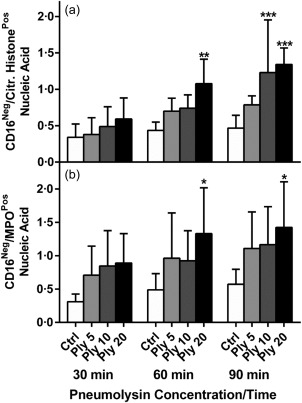
Figure 2.

Flow cytometric determination of pneumolysin (Ply) (5, 10 and 20 ng ml−1)‐activated NETosis over a 30–90‐min time–course. The results of five separate experiments (n = 5) are expressed as the mean percentages of total Vybrant® DyeCycle™ (VDC) Ruby+ events [standard deviation (s.d.)], including intact nucleated cells. *P < 0·05; **P < 0·01; ***P < 0·001. A two‐way analysis of variance (anova) with Sidak's multiple comparison test were used to determine significance of the various Ply concentrations at different time‐points.
