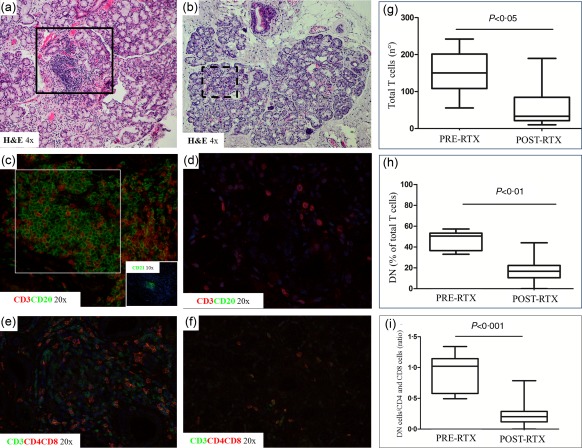
Figure 2.

Histological analysis of primary Sjögren's syndrome (pSS) minor salivary gland biopsies before and after rituximab treatment. Histological analysis of minor salivary gland (MSG) biopsy at baseline (T0; a,c,e) and T12 (b,d,f) of pSS patients treated with rituximab; ×4, ×10 and ×20 = level of magnification of the corresponding picture. H&E = haematoxylin and eosin. (g–i) The count of CD3+ T cells (g), the percentage of double‐negative (DN) among total T cells (h) and the ratio of DN and CD4+ and CD8+ T cells (i). The plots display mean ± standard error of the mean. P‐values were calculated with Wilcoxon's matched‐pairs test.
