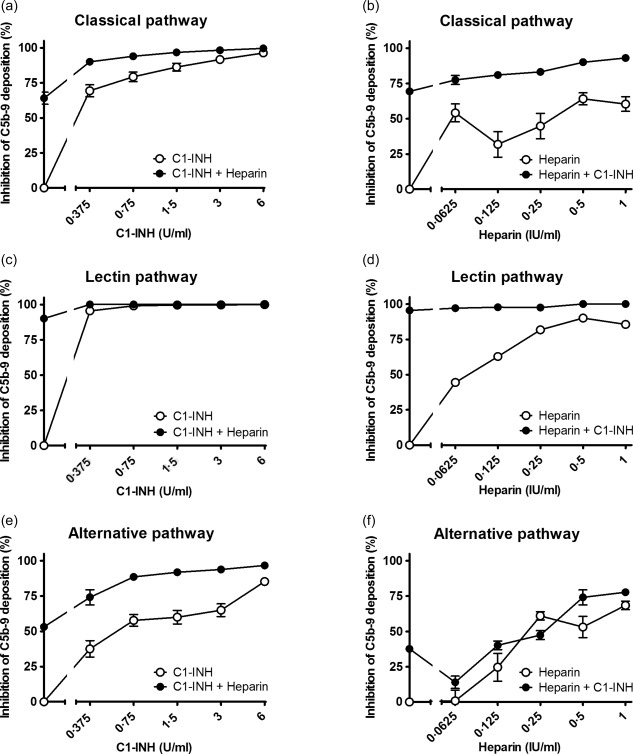
Figure 5.

Inhibition of C1‐inhibitor (C1‐INH) in combination with heparin on the classical pathway (a,b), the lectin pathway (c,d) and the alternative pathway (e,f). Increasing concentrations of C1‐INH were co‐incubated with 0·5 IU/ml heparin (a,c,e) or increasing concentrations of heparin were co‐incubated with 0·375 U/ml C1‐INH (b,d,f) in pooled human serum (x‐axis, log2 scale). The inhibition of C5b‐9 deposition was calculated by dividing the optical density (OD) of the sample with heparinoid by the control, the sample without heparinoid (y‐axis). Data are expressed as the mean and standard error of the mean of three experiments.
