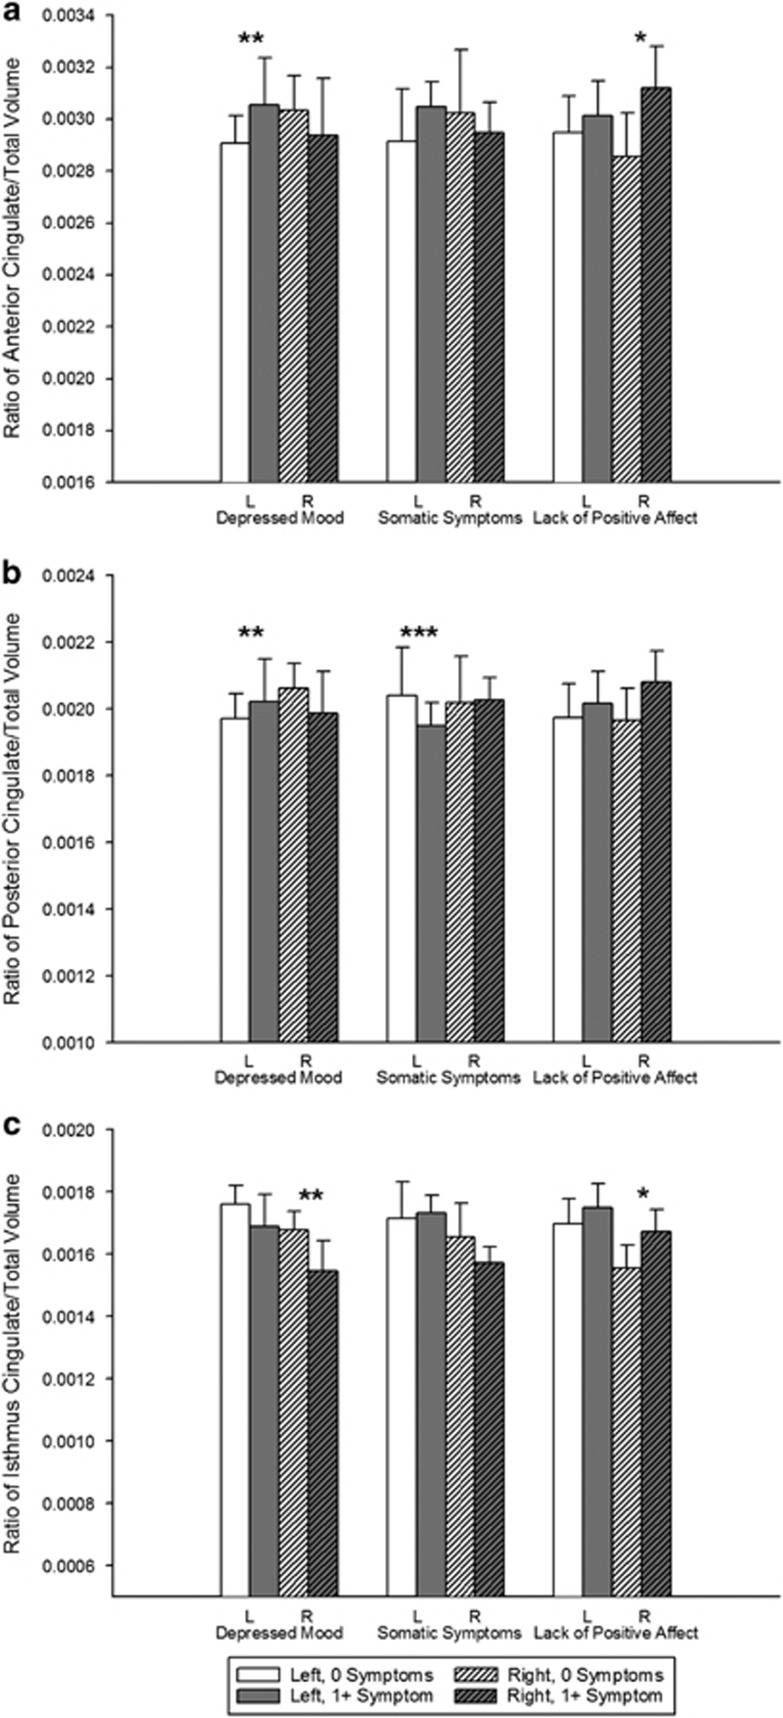
Figure 1.
Least-square means showing the ratio of regional to total volume by hemisphere and the Center for Epidemiologic Studies Depression Scale (CES-D) subscale score for the (a) anterior cingulate, (b) posterior cingulate and (c) isthmus cingulate. The CES-D groups are for graphical purposes only; CES-D scores were continuous measures in all analyses. Error bars represent s.e. *represents nonsignificant trends, **P<0.05 and ***P<0.01.

