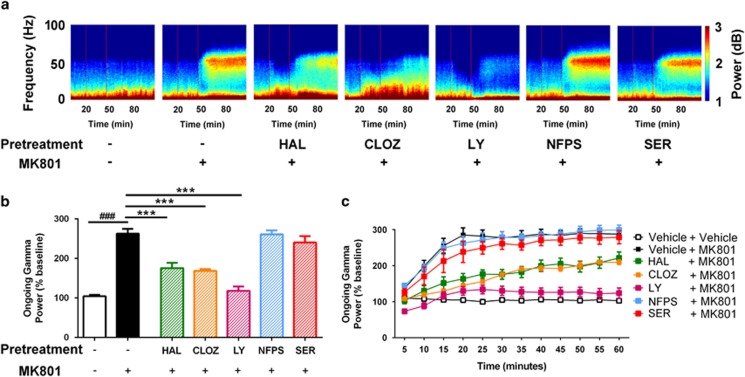
Figure 5.
Effects of drugs on ongoing electrophysiological activity in the MK801 experiment. (a) Heat maps of drug effects on spectral power over time. The two red vertical lines represent the injection of the test drug at t=20, and of MK801 at t=45 min. (b) Quantification of the effects of drugs on gamma power following the injection of MK801, relative to the pre-injection period. MK801 induced a marked increase in ongoing gamma power, and this was significantly blunted by pretreatment with HAL, CLOZ and LY, but not affected by NFPS or SER. (c) These effects are also evident when visualizing the effect of pretreatments over the time course of the experiment. ###P<0.001 represents the significant difference between vehicle and MK801; ***P<0.001 represents the significant difference between test drug+MK801 and vehicle+MK801 conditions. CLOZ, clozapine; HAL, haloperidol; LY, LY279368; NFPS, sarcosine; SER, d-serine.

