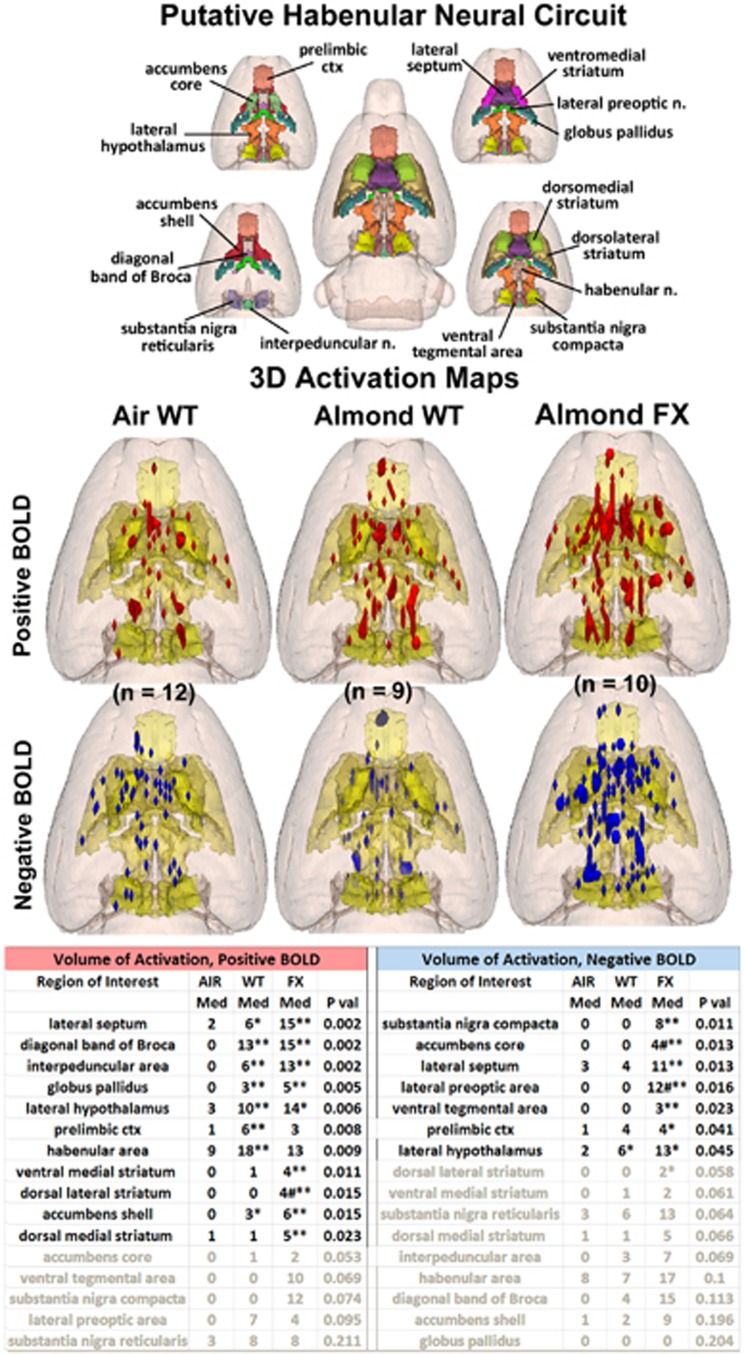
Figure 5.
Putative habenular neural circuit shown above are three-dimensional (3D) colored volumes of 16 areas comprising the putative habenular neural circuit. The color-coded volumes are coalesced into a single volume shown in yellow below for each of the three experimental conditions. The description of data presentation is the same as Figure 2. There were no differences between WT and FX for positive BOLD except the dorsal medial striatum (#P<0.05). Several areas were different between WT and FX for negative BOLD. All the other differences are voxel numbers greater than AIR. *P<0.05, **P<0.01. BOLD, blood oxygen level dependent; FX, fragile X; WT, wild type.

