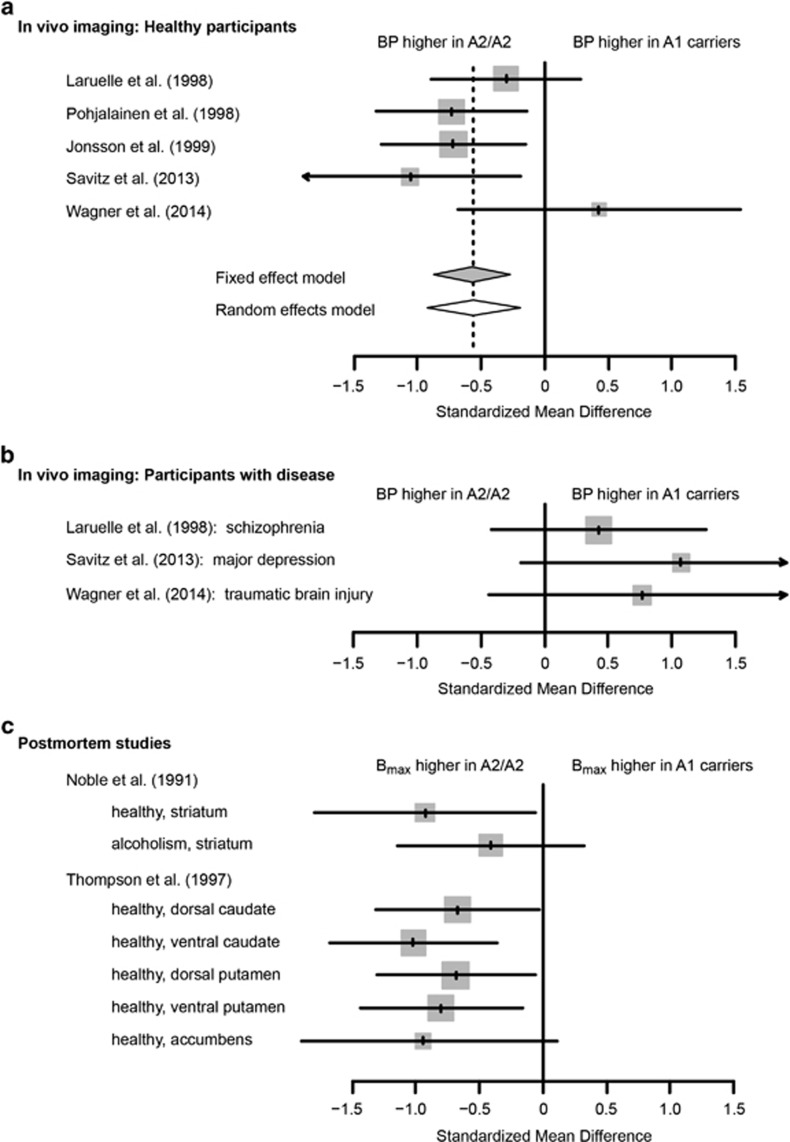
Figure 2.
Forest plots of effect size for rs1800497 (Taq1A) and D2 receptor binding. Each genotype group comparison is represented by a gray square and horizontal error bars (mean and 95% confidence intervals). Square size is proportional to study weight. The solid vertical line represents the null hypothesis (no effect of the genetic variant). (a) In vivo imaging studies of healthy participants. Diamonds represent means and 95% confidence intervals for the fixed-effect model (filled diamond) and random-effects model (open diamond). The dashed vertical line is the fixed-effect weighted mean. (b) In vivo imaging studies of participants with disease. (c) Postmortem studies. BP, binding potential; Bmax, total number of receptors.

