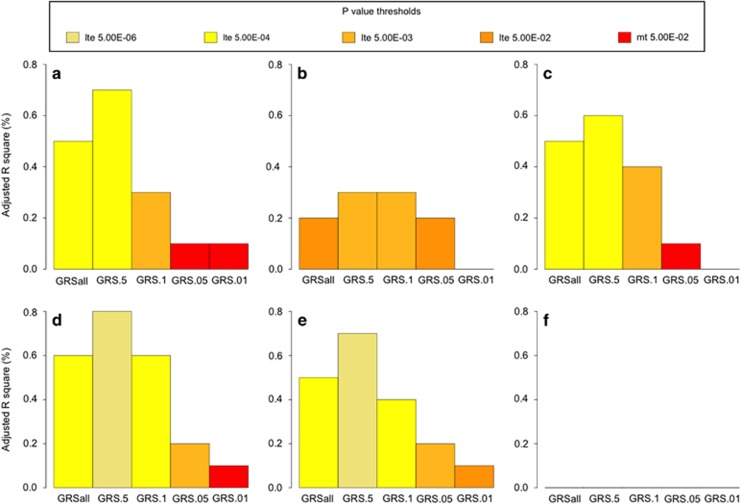
Figure 1.
GRS generated from an analysis of AO-AD in a discovery sample, at varying P-value thresholds, predicting (a) AO-AD, (b) AO-I, (c ) AD, (d) AD-SX, (e) Maxdrinks and (f) height in SAGE dataset. The x-axis represents the GRS thresholds and y-axis represents the adjusted R2 for the trait. Each bar represents the values of adjusted R2 for SAGE. Colors of the bar represent the level of significance achieved. AD, alcohol dependence; AD-SX, total number of DSM4 AD symptoms endorsed; AO-AD, age at onset of AD; AO-I, age at onset of intoxication; GRS, genome-wide polygenic scores; SAGE, Study of Addictions: Genes and Environment.

