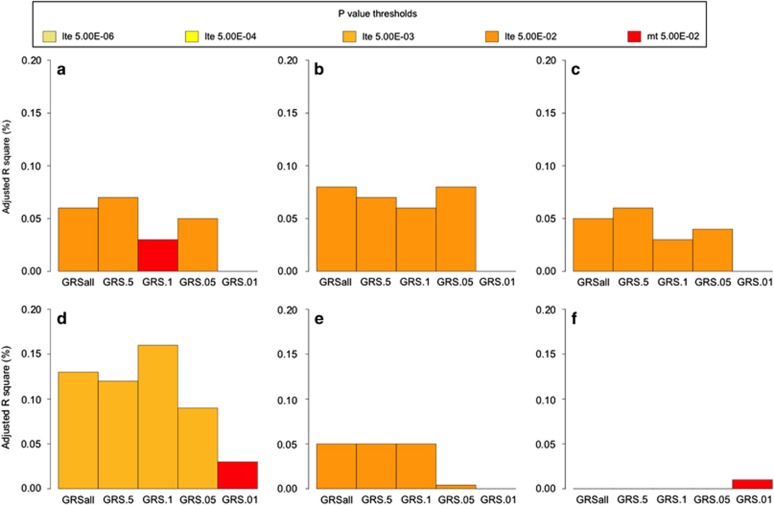
Figure 2.
GRS generated from an analysis of AO-AD in a discovery sample, at varying P-value thresholds, predicting (a) AO-AD, (b) AO-I, (c ) AD, (d) AD-SX, (e) Maxdrinks and (f) height in OZ-ALC dataset. The x-axis represents the GRS thresholds and y-axis represents the adjusted R2 for the trait. Each bar represents the values of adjusted R2 for OZ-ALC. Colors of the bar represent the significance level achieved. AD, alcohol dependence; AD-SX, total number of DSM4 AD symptoms endorsed; AO-AD, age at onset of AD; AO-I, age at onset of intoxication; GRS, genome-wide polygenic scores.

