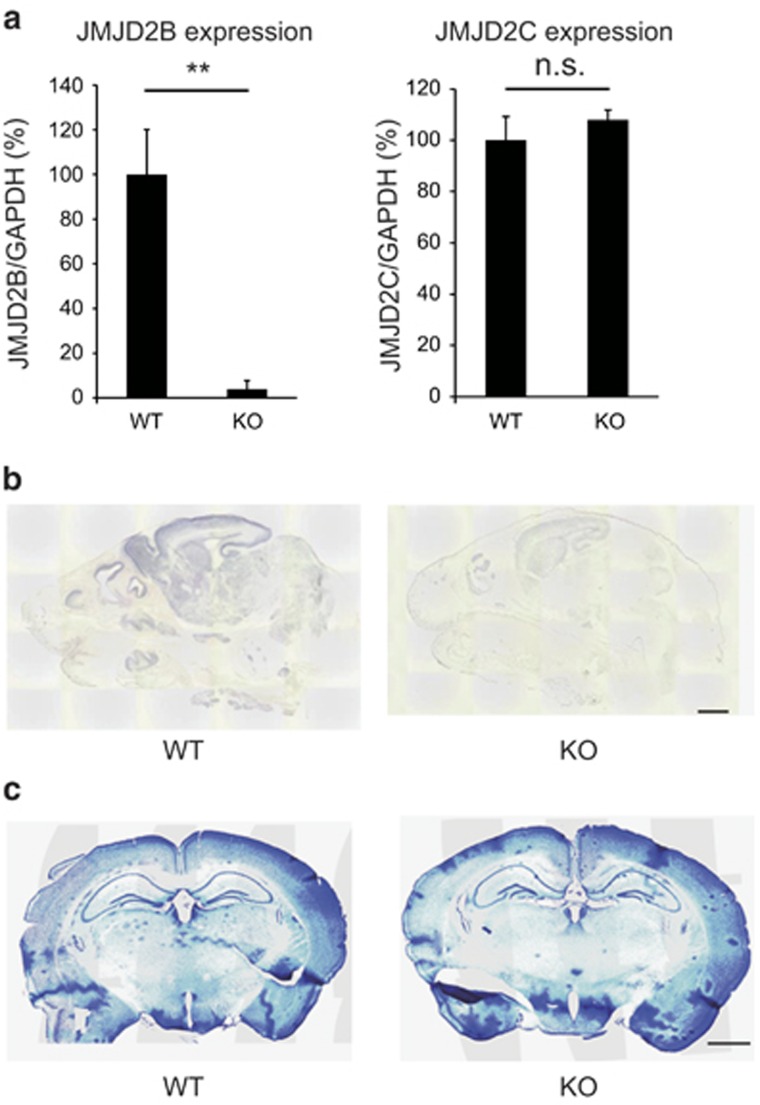
Figure 2.
Generation of neuron-specific Jmjd2b mutant mice. (a) Relative expression level of Jmjd2b and Jmjd2c. The expression level was normalized to Gapdh. **P<0.01; NS, not significant. (WT, KO: n=3) Error bars represent s.e.m. (b) Expression of Jmjd2b mRNA in WT and KO mice. P0 mice were used for in situ hybridization. (WT, KO: n=1). (c) Nissl staining showing the gross morphology of the brain in the two genotypes. (WT, KO: n=3). KO, JMJD2B mutant mice; WT, wild-type mice. Scale bars: (b) 1 mm, (c) 50 μm.

