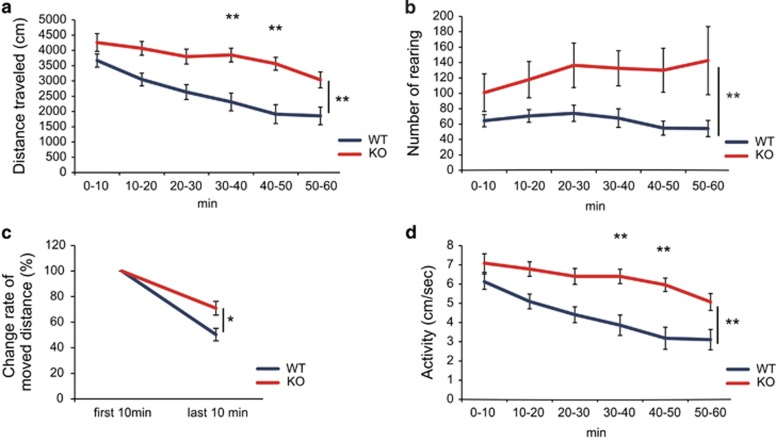
Figure 4.
JMJD2B mutant mice reveal hyperactivity in the open-field test.(a) The graph shows the distance moved during the indicated time period. (b) The graph shows the temporal change in the rate of activity (speed). (c) The graph shows the distance moved in the first 10 min versus the last 10 min (50 to 60 min) of assessment. (d) The graph shows temporal changes in rearing number. (WT: n=12, KO: n=10). WT, wild-type mice; KO, JMJD2B mutant mice. *P<0.05; **P<0.01. Error bars represent s.e.m.

